Collect VM client event logs
Azure Monitor Metrics and VM insights performance counters help you identify performance anomalies and alert when thresholds are reached. But to analyze the root causes of issues you detect, you need to analyze log data to see which system events caused or contributed to the issues. In this unit, you set up a data collection rule (DCR) to collect Linux VM Syslog data, and view the log data in Azure Monitor Log Analytics by using a simple Kusto Query Language (KQL) query.
VM insights installs the Azure Monitor Agent and creates a DCR that collects predefined performance counters, maps process dependencies, and presents the data in prebuilt workbooks. You can create your own DCRs to collect VM performance counters that the VM insights DCR doesn't collect, or to collect log data.
When you create DCRs in the Azure portal, you can select from a range of performance counters and sampling rates, or add custom performance counters. Or, you can select from a predefined set of log types and severity levels or define custom log schemas. You can associate a single DCR to any or all VMs in your subscription, but you might need multiple DCRs to collect different types of data from different VMs.
Create a DCR to collect log data
In the Azure portal, search for and select monitor to go to the Azure Monitor Overview page.

Create a Data Collection Endpoint
You must have a data collection endpoint to send log data to. To create an endpoint:
- In the Azure Monitor left navigation menu under Settings, select Data Collection Endpoints.
- On the Data Collection Endpoints page, select Create.
- On the Create data collection endpoint page, for Name, enter linux-logs-endpoint.
- Select the same Subscription, Resource group, and Region as your VM uses.
- Select Review + create, and when validation passes, select Create.
Create the Data Collection Rule
To create the DCR to collect the event logs:
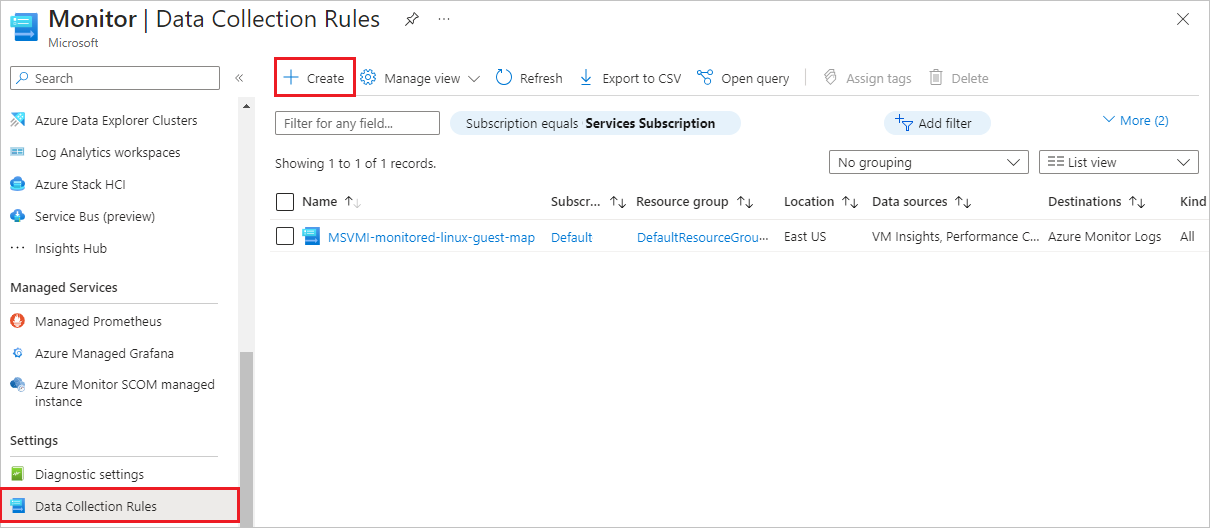
In the Monitor left navigation menu under Settings, select Data Collection Rules.
On the Data Collection Rules page, you can see the DCR that VM insights created. Select Create to create a new data collection rule.
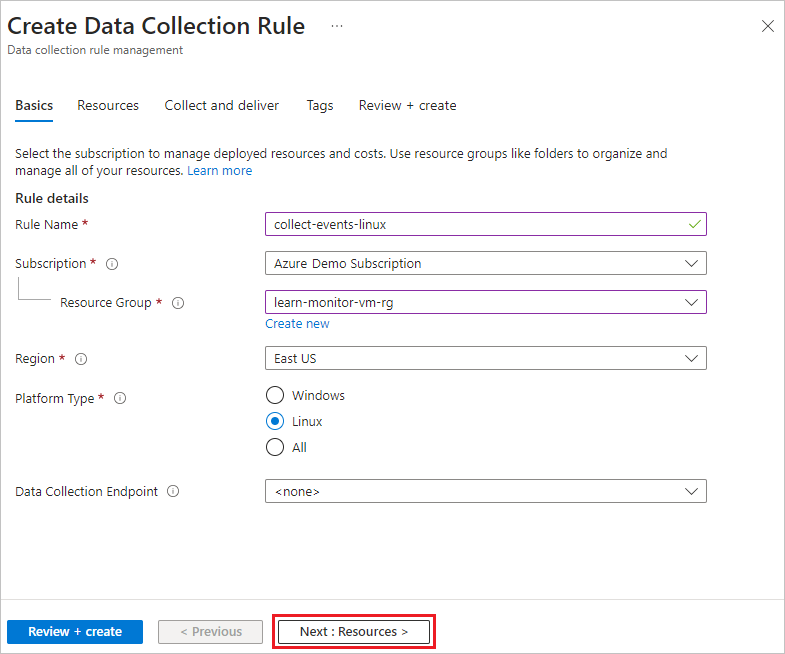
On the Basics tab of the Create Data Collection Rule screen, provide the following information:
- Rule name: Enter collect-events-linux.
- Subscription, Resource Group, and Region: Select the same as for your VM.
- Platform Type: Select Linux.
Select Next: Resources or the Resources tab.
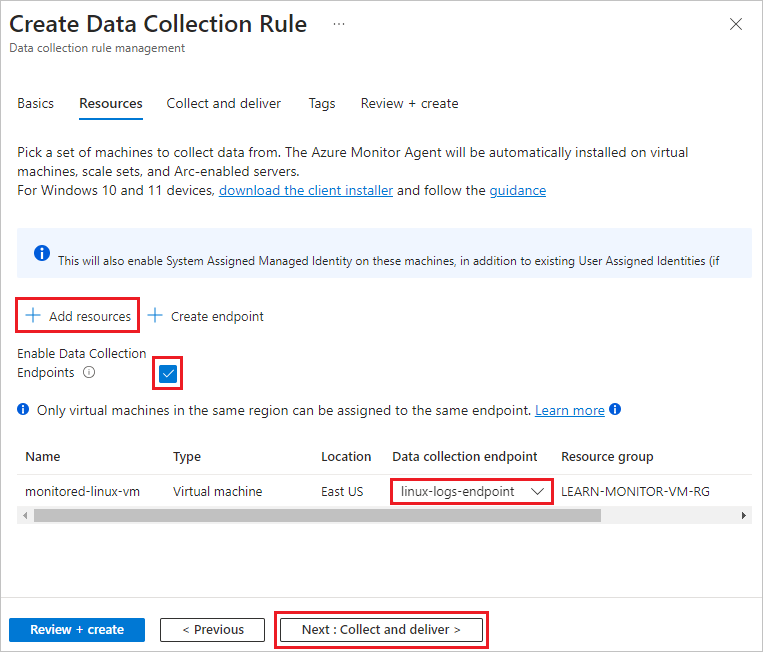
On the Resources screen, select Add resources.
On the Select a scope screen, select the monitored-linux-vm VM, and then select Apply.
On the Resources screen, select Enable Data Collection Endpoints.
Under Data collection endpoint for the monitored-linux-vm, select the linux-logs-endpoint you created.
Select Next: Collect and deliver, or the Collect and deliver tab.
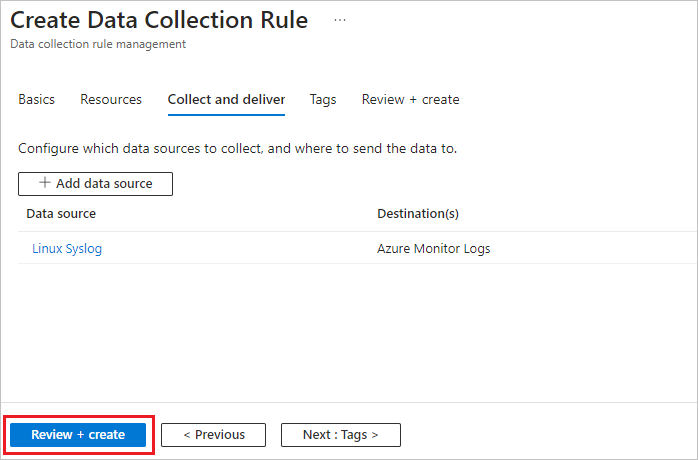
On the Collect and deliver tab, select Add data source.
On the Add data source screen, under Data source type, select Linux Syslog.
On the Add data source screen, select Next: Destination or the Destination tab, and make sure the Account or namespace matches the Log Analytics workspace that you want to use. You can use the default Log Analytics workspace that VM insights set up, or create or use another Log Analytics workspace.
On the Add data source screen, select Add data source.
On the Create Data Collection Rule screen, select Review + create, and when validation passes, select Create.


View log data
You can view and analyze the log data collected by your DCR by using KQL log queries. A set of sample KQL queries is available for VMs, but you can write a simple query to look at the events your DCR is collecting.
On your VM's Overview page, select Logs from the left navigation menu under Monitoring. Log Analytics opens an empty query window with the scope set to your VM.
You can also access log data by selecting Logs from the left navigation of the Azure Monitor Overview page. If necessary, select Select scope at the top of the query window to scope the query to the desired Log Analytics workspace and VM.
Note
The Queries window with sample queries might open when you open Log Analytics. For now, close this window, because you're going to manually create a simple query.
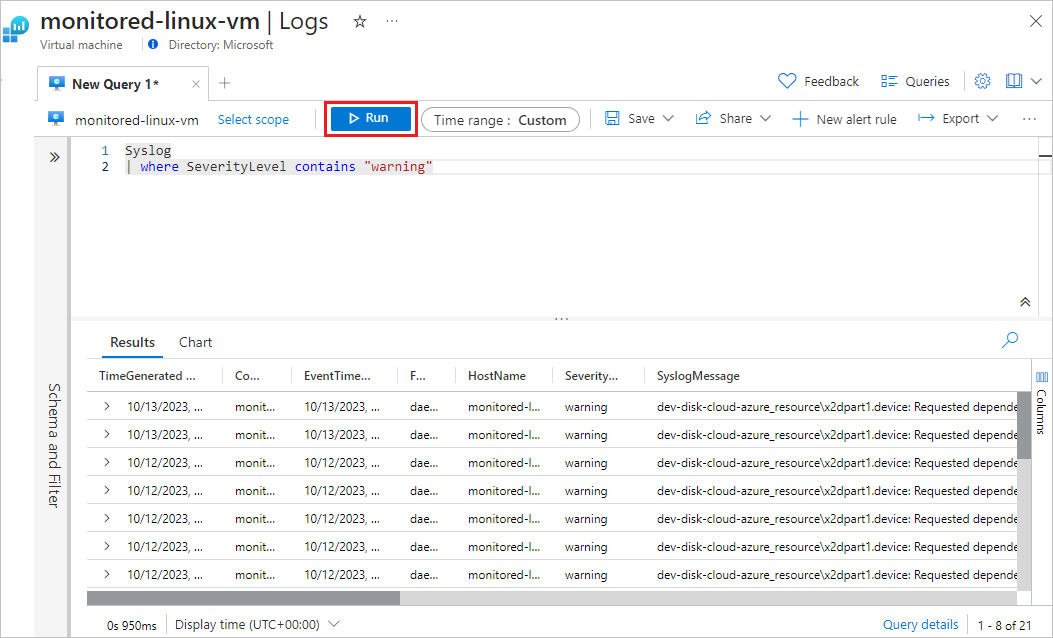
In the empty query window, type Syslog, and then select Run. All the system log events the DCR collected within the Time range are displayed.
You can refine your query to identify events of interest. For example, you can display only the events that had a SeverityLevel of warning.