Capacity planning guidance for Power BI Report Server
Power BI Report Server is a self-service BI and enterprise reporting solution that customers can deploy on their premises, behind their firewall. It combines the interactive report capability of Power BI Desktop with the on-premises server platform of SQL Server Reporting Services. With heavy and growing usage of analytics and reporting within enterprises, budgeting the hardware infrastructure and software licenses required to scale to an enterprise user base can be a challenge. This paper aims to offer guidance on capacity planning for Power BI Report Server by sharing results of numerous load test executions of various workloads against a report server. While organizations' reports, queries, and usage patterns vary widely, the results presented in this paper, along with the actual tests used and a detailed description of how they were executed, serve as a reference point for anyone in the early-stage planning process of deploying Power BI Report Server.
Executive summary
We executed two different types of workloads against Power BI Report Server; each workload consisted of rendering different types of reports as well as performing various web portal operations.
- In "Power BI Report Heavy" workload, the most frequently executed operation (i.e. the operation executed 60% of the time) was rendering Power BI reports.
- In "Paginated Report Heavy" workload, the most frequently executed operation was rendering paginated reports.
Under a four-server topology of Power BI Report Server and the expectation that no more than 5% of users will access a report server at any one time, the following table describes the maximum number of users Power BI Report Server can handle with at least 99% reliability.
| Workload | 8 Core/32 GB RAM | 16 Core/64 GB RAM |
|---|---|---|
| Power BI Report Heavy (>60%) | 1,000 users | 3,000 users |
| Paginated (RDL) Report Heavy (>60%) | 2,000 users | 3,200 users |
In each run, the most overwhelmed resource was CPU. Due to this, increasing the number of cores to Power BI Report Server would yield a higher gain in the reliability of the system than increasing the amount of memory or hard-disk space.
Test methodology
The testing topology used was based on Microsoft Azure Virtual Machines instead of vendor-specific physical hardware. All machines were hosted in US regions. This reflects the general trend of hardware virtualization both on-premises and in the public cloud.
Power BI Report Server topology
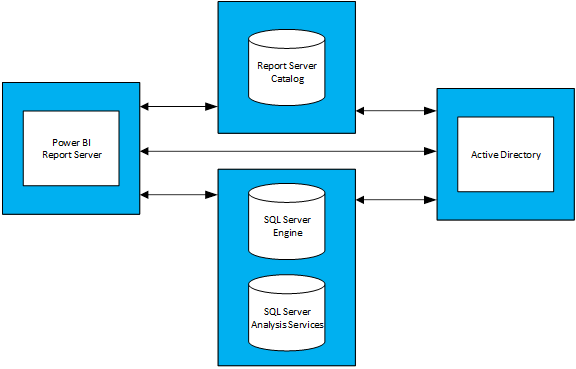
The Power BI Report Server deployment consisted of the following virtual machines:
- Active Directory Domain Controller: this was needed by SQL Server Database Engine, SQL Server Analysis Services, and Power BI Report Server to securely authenticate all requests.
- SQL Server Database Engine and SQL Server Analysis Services: this was where we stored all the databases for the reports to consume when we rendered them.
- Power BI Report Server
- Power BI Report Server Database. The report server database is hosted on a different machine than Power BI Report Server so that it does not need to compete with SQL Server Database Engine for memory, CPU, network, and disk resources.
See Appendix 1.1 Power BI Report Server Topology and Appendix 1.2 Power BI Report Server Virtual Machine Configuration for a thorough configuration of each virtual machine used in the topology.
Tests
The tests used in the load test runs are publicly available in a GitHub project called Reporting Services LoadTest. This tool allows users to study the performance, reliability, scalability and recoverability characteristics of SQL Server Reporting Services and Power BI Report Server. This project consists of four groups of test cases:
- Tests simulating rendering Power BI reports,
- Tests simulating rendering mobile reports,
- Tests simulating rendering small and large paginated reports, and
- Tests simulating performing various types of web portal operations.
All tests were written to perform an end-to-end operation (such as rendering a report, creating a new data source, etc.). They accomplish this by making one or more web requests to the report server (via APIs). In the real world, a user may need to perform a few intermediate operations to complete one of these end-to-end operations. For example, to render a report a user will need to go to the web portal, navigate to the folder where the report is, then click the report to render it. While tests don't perform all the operations needed to accomplish an end-to-end task, they still impose most of the load that Power BI Report Server would experience. You can learn more about the different types of reports used as well as the variety of operations performed by exploring the GitHub project.
Note
The tool isn't officially supported by Microsoft, but the product team does contribute to the project and answer issues that are raised by other contributors.
Workloads
There are 2 workload profiles used in testing: Power BI Report Heavy and Paginated Report Heavy. The table below describes the distribution of requests executed against the Report Server.
| Activity | Power BI Report Heavy, Frequency of occurrence | Paginated Report Heavy, Frequency of occurrence |
|---|---|---|
| Rendering Power BI reports | 60% | 10% |
| Rendering paginated (RDL) reports | 30% | 60% |
| Rendering mobile reports | 5% | 20% |
| Web portal operations | 5% | 10% |
User load
For each test run, tests were executed based on the frequency specified in one of the two workloads. Tests started with 20 concurrent user requests to the report server. The user load was then gradually increased until reliability dropped below the 99% target.
Results
Concurrent user capacity
As stated earlier, tests started with 20 concurrent users making requests to the report server. The number of concurrent users was then gradually increased until 1% of all requests were failing. The results in the following table tell us the number of concurrent user requests that the server would be able to handle under peak load with a failure rate of less than 1%.
| Workload | 8 Core/32 GB | 16 Core/64 GB |
|---|---|---|
| Power BI Report Heavy | 50 concurrent users | 150 concurrent users |
| Paginated Report Heavy | 100 concurrent users | 160 concurrent users |
Total user capacity
At Microsoft, we have a production deployment of Power BI Report Server that several teams used. When we analyze actual usage of this environment, we observe that the number of concurrent users at any given time (even during daily peak load) doesn't tend to exceed 5% of the total user base. Using this 5% concurrency ratio as a benchmark, we extrapolated the total user base Power BI Report Server could handle with 99% reliability.
| Workload | 8 Core/32 GB | 16 Core/64 GB |
|---|---|---|
| Power BI Report Heavy | 1,000 users | 3,000 users |
| Paginated Report Heavy | 2,000 users | 3,200 users |
Summary
For each load test run, CPU was the most overwhelmed resource at the point of peak load on the Power BI Report Server machine. Due to this, the first resource that should be increased is the number of cores. Alternately, you can consider scaling out by adding more servers hosting Power BI Report Server in your topology.
The results presented in this paper were derived from executing a specific set of reports consuming a specific set of data, repeated in a specific way. It's a useful reference point, but keep in mind that your usage will depend on your reports, queries, usage patterns and deployment of your Power BI Report Server.
Appendix
1 Topology
1.1 Power BI Report Server Topology
To focus solely on Power BI Report Server behavior under different configurations, the VM configuration for each type of machine (except for the machine hosting Power BI Report Server) was fixed. Each machine was provisioned according to the second-generation (v2) D Series machines with Premium Storage Disks. You can find detailed information about each VM size under the "General Purpose" section.
| Virtual Machine Type | Processor | Memory | Azure VM Size |
|---|---|---|---|
| Active Directory Domain Controller | 2 Cores | 7 GB | Standard_DS2_v2 |
| SQL Server Database Engine and Analysis Services | 16 Cores | 56 GB | Standard_DS5_v2 |
| Report Server Database | 16 Cores | 56 GB | Standard_DS5_v2 |
1.2 Power BI Report Server Virtual Machine Configuration
Different configurations of processor and memory were used for the Virtual Machine hosting Power BI Report Server. Unlike the other VMs, this machine was provisioned according to the third-generation (v3) D Series Machines with Premium Storage Disks. You can find detailed information about this VM size under the "General Purpose" section
| Virtual Machine | Processor | Memory | Azure VM Size |
|---|---|---|---|
| Power BI Report Server (Small) | 8 Cores | 32 GB | Standard_D8S_v3 |
| Power BI Report Server (Large) | 16 Cores | 64 GB | vStandard_D16S_v3 |
2 Run the LoadTest tool
If you'd like to run the Reporting Services LoadTest tool against your or a Microsoft Azure deployment of Power BI Report Server, follow these steps.
- Clone the Reporting Services LoadTest project from GitHub (https://github.com/Microsoft/Reporting-Services-LoadTest).
- In the project directory, you will find a solution file called RSLoadTests.sln. Open this file in Visual Studio 2015 or later.
- Determine whether you want to run this tool against your deployment of Power BI Report Server or against a deployment of Power BI Report Server in Microsoft Azure. If you are going to run it against your own deployment, go to step 5.
- Follow the instructions listed on https://github.com/Microsoft/Reporting-Services-LoadTest#create-a-sql-server-reporting-services-load-environment-in-azure to create a Power BI Report Server environment in Azure.
- Once you finish deploying the environment, follow the instructions listed on https://github.com/Microsoft/Reporting-Services-LoadTest#load-test-execution to run the tests.
More questions? Try asking the Power BI Community
Feedback
Coming soon: Throughout 2024 we will be phasing out GitHub Issues as the feedback mechanism for content and replacing it with a new feedback system. For more information see: https://aka.ms/ContentUserFeedback.
Submit and view feedback for