Tag barcode fields in Power BI Desktop
In Power BI Desktop, you can categorize data in a column, so that Power BI Desktop knows how to treat values in visuals in a report. You can also categorize a column as Barcode. Then, you can let someone in your organization scan a barcode on a product by using the Power BI mobile app on their iOS or Android device. This barcode lets them see any report that includes it. When they open the report, it automatically filters to the data related to that barcode.
Categorize barcode data
Assuming you have a report that includes barcodes:
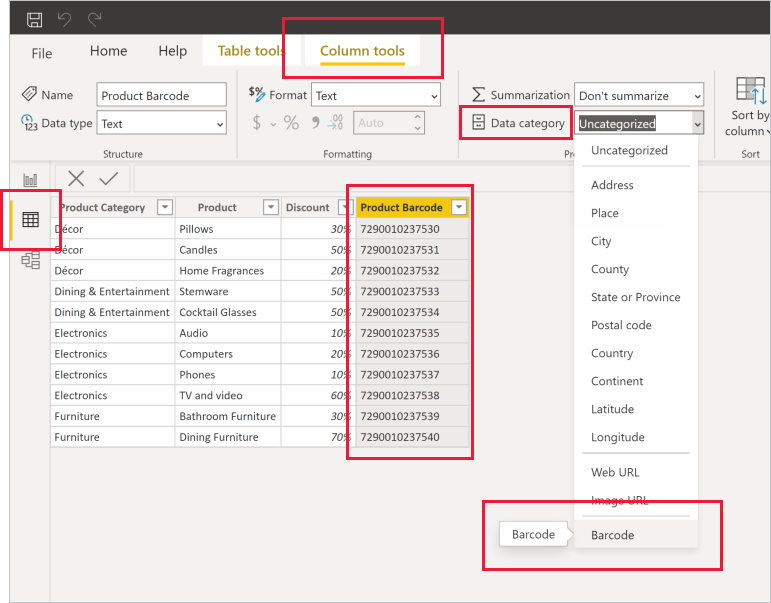
In Power BI Desktop, switch to Data view.
Select the column that contains the barcode data. See the list of supported barcode formats in the following section.
On the Column tools tab, select Data category > Barcode.
Warning
Do not categorize more than one column across all data tables in a report as Barcode. The mobile apps support barcode filtering only for reports that have only one barcode column across all report data tables. If a report has more than one barcode column, no filtering takes place.
In Report view, add the barcode field to the visuals you want filtered by the barcode.
Save the report, and publish it to the Power BI service.
Now when you open the scanner on the Power BI apps for iOS and Android devices, you can scan a barcode. Then you can see this report in the list of reports that have barcodes. When you open the report, it filters the visuals by the product barcode you scanned.
Supported barcode formats
Power BI recognizes these barcode formats if you can tag them in a Power BI report:
- UPCECode
- Code39Code
- A39Mod43Code
- EAN13Code
- EAN8Code
- 93Code
- 128Code
- PDF417Code
- Interleaved2of5Code
- ITF14Code
Related content
Feedback
Coming soon: Throughout 2024 we will be phasing out GitHub Issues as the feedback mechanism for content and replacing it with a new feedback system. For more information see: https://aka.ms/ContentUserFeedback.
Submit and view feedback for