Note
Access to this page requires authorization. You can try signing in or changing directories.
Access to this page requires authorization. You can try changing directories.
In this Quickstart, you explore how to use the Visual Studio debugger to you debug your C# or Visual Basic apps. This article provides a quick way to learn some of the basic features for working in the debugger.
If you don't have Visual Studio, you can install the free trial version from the Visual Studio Downloads page.
Create a new project
Start by creating a new project, so you have some code to check in the debugger. This example creates a C# project for .NET.
Open Visual Studio and create a new project.
If the Start Window isn't open, select File > Start Window.
In the Start Window, select Create a new project.
In the Create a new project window, set the filters and search for a project template.
In the Search for templates box, enter console.
Expand the Language dropdown and select C#.
Expand the Platform dropdown list and select Windows.
In the list of results, select the Console App template, and then select Next.
If you don't see the Console App project template, select the Continue without code option.
Select Tools > Get Tools and Features..., which opens the Visual Studio Installer.
In the Installer window, select the checkbox for the .NET desktop development workload, and then select Modify.
Your Visual Studio installation updates to include the selected .NET workload.
After the update completes, select File > Start Window, and follow the previous instructions to select the required template.
Configure the new project:
Enter a Project name and Solution name, or use the default values.
Use the default Location or select browse (...) to create the project in a different folder.
Select Next.
Use the recommended target Framework (the default is .NET 10.0 Long Term Support).
Select Create.
Visual Studio creates your new project and adds the project files in the specified folder.
Update the project code
Update some of the code supplied by the project template so you have more statements to test in the debugger.
In the Solution Explorer pane, select the Program.cs item.
The Program.cs file opens in the code editor. (If you're working in Visual Basic, select the Module1.vb item.)
Replace the file contents with the following code.
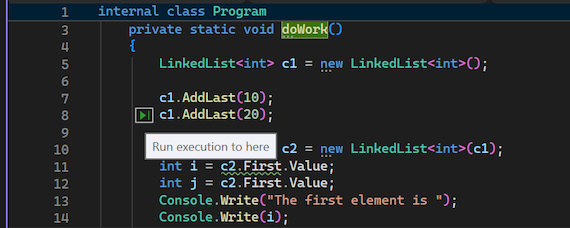
 internal class Program
 {
     private static void doWork()
     {
         LinkedList<int> c1 = new LinkedList<int>();

         c1.AddLast(10);
         c1.AddLast(20);

         LinkedList<int> c2 = new LinkedList<int>(c1);
         int i = c2.First.Value;
         int j = c2.First.Value;
         Console.Write("The first element is ");
         Console.Write(i);
         Console.Write("\n");
         Console.Write("The second element is ");
         Console.Write(j);
         Console.Write("\n");
     }

     static int Main()
     {
         // using namespace std;
         doWork();
         return 0;
     }
 }
Save your changes with the Ctrl+S keyboard shortcut.
Set a breakpoint
A breakpoint is a marker that indicates where Visual Studio should suspend your running code. When a breakpoint is set, you can take a look at the current values of variables, examine the behavior of memory, and check if a specific branch of code is running. Breakpoints are the most basic feature in debugging.
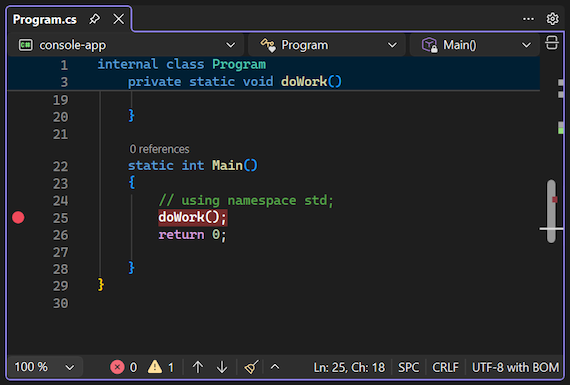
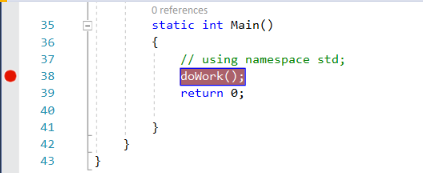
To set a breakpoint, locate the call to the
doWork()function in the code, and then select in the left gutter on the same line.When the breakpoint is set, a red dot displays in the left gutter on the corresponding line in the code.
Start debugging by using the F5 keyboard shortcut (or select Debug > Start Debugging).
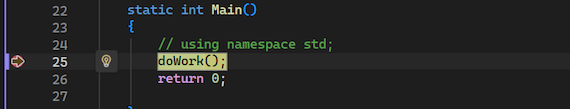
Code execution pauses immediately before the call to the
doWork()function.The debugger pauses where you set the breakpoint. A yellow arrow identifies the statement where the debugger pauses app execution.
Set conditional breakpoints
If you set a breakpoint in a loop or recursion, or if you have many breakpoints that you frequently step through, use a conditional breakpoint.
This approach helps ensure your code is suspended only when specific conditions are met. A conditional breakpoint can save time and also make it easier to debug issues that are hard to reproduce.
Walk through your code
Visual Studio provides several different ways for instructing the debugger to continue with app execution. The following example shows a useful command for walking through your code.
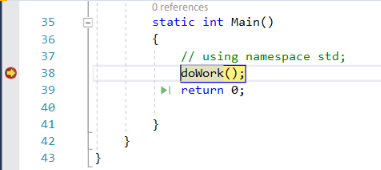
While the code is paused at the breakpoint, hover over the statement c1.AddLast(20) until you see the green Run to click (Run execution to here)  icon. Select the icon.
While the code is paused at the breakpoint, hover over the statement c1.AddLast(20) until you see the green Run to click (Run execution to here)  icon. Select the icon.
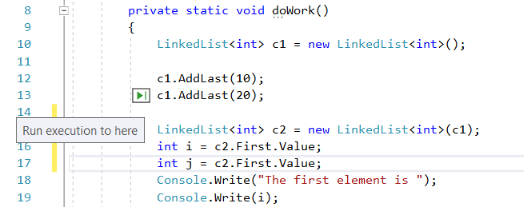
The app continues execution, calling doWork, and pauses on the line of code where you selected Run to click.
Common keyboard commands used to step through code include F10 and F11. For more in-depth instructions, see Overview of the Visual Studio debugger.
Inspect variables in a data tip
You can inspect the state of your variables by using the data tip feature.
In the current line of code (marked by the yellow execution pointer), hover over the
c1object to see the data tip.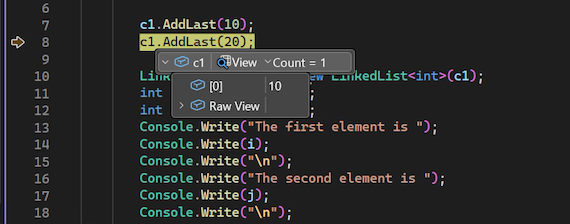
The data tip shows you the current value of the
c1variable and allows you to inspect its properties.When you're debugging, if you see an unexpected value for a variable, you probably have a bug. The bug could be in the code that makes the call to the variable or in the previous line.
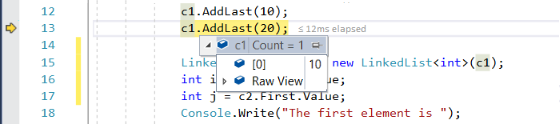
Expand the data tip to look at the current property values of the
c1object.To continue checking the value of
c1as the code executes, select the pin icon on the data tip.
The pin action keeps the data tip open. As the code executes, the value in the pinned tip changes to show the current state of the watched object.
You can move the pinned tip to any location in the IDE, so it doesn't prevent you watching other items while debugging.
Enable hot reload while debugging
While you're debugging, if you see a change that you want to test in your code, you can use the Hot Reload feature (previously called Edit and Continue).
Select the second instance of the
c2.First.Valuestatement, and change the code toc2.Last.Value.Select F10 a few times (or select Debug > Step Over a few times) to advance the debugger and execute the edited code.
F10 advances the debugger one statement at a time, but steps over functions instead of stepping into them (the code that you skip still executes).
For more information about the feature and limitations, see Configure Hot Reload.