Configure data collection and cost optimization in Container insights using data collection rule
This article describes how to configure data collection in Container insights using the data collection rule (DCR) for your Kubernetes cluster. This includes preset configurations for optimizing your costs. A DCR is created when you onboard a cluster to Container insights. This DCR is used by the containerized agent to define data collection for the cluster.
The DCR is primarily used to configure data collection of performance and inventory data and to configure cost optimization.
Specific configuration you can perform with the DCR includes:
- Enable/disable collection and namespace filtering for performance and inventory data.
- Define collection interval for performance and inventory data
- Enable/disable Syslog collection
- Select log schema
Important
Complete configuration of data collection in Container insights may require editing of both the DCR and the ConfigMap for the cluster since each method allows configuration of a different set of settings.
See Configure data collection in Container insights using ConfigMap for a list of settings and the process to configure data collection using ConfigMap.
Prerequisites
- AKS clusters must use either System or User Assigned Managed Identity. If cluster is using a Service Principal, you must upgrade to Managed Identity.
Configure data collection
The DCR that gets created when you enable Container insights is named MSCI-<cluster-region>-<cluster-name>. You can view it in the Azure portal by selecting the Data Collection Rules option in the Monitor menu in the Azure portal. Rather than directly modifying the DCR, you should use one of the methods described below to configure data collection. See Data collection parameters for details about the different available settings used by each method.
Warning
The default Container insights experience depends on all the existing data streams. Removing one or more of the default streams makes the Container insights experience unavailable, and you need to use other tools such as Grafana dashboards and log queries to analyze collected data.
You can use the Azure portal to enable cost optimization on your existing cluster after Container insights has been enabled, or you can enable Container insights on the cluster along with cost optimization.
Select the cluster in the Azure portal.
Select the Insights option in the Monitoring section of the menu.
If Container insights has already been enabled on the cluster, select the Monitoring Settings button. If not, select Configure Azure Monitor and see Enable monitoring on your Kubernetes cluster with Azure Monitor for details on enabling monitoring.

For AKS and Arc-enabled Kubernetes, select Use managed identity if you haven't yet migrated the cluster to managed identity authentication.
Select one of the cost presets described in Cost presets.

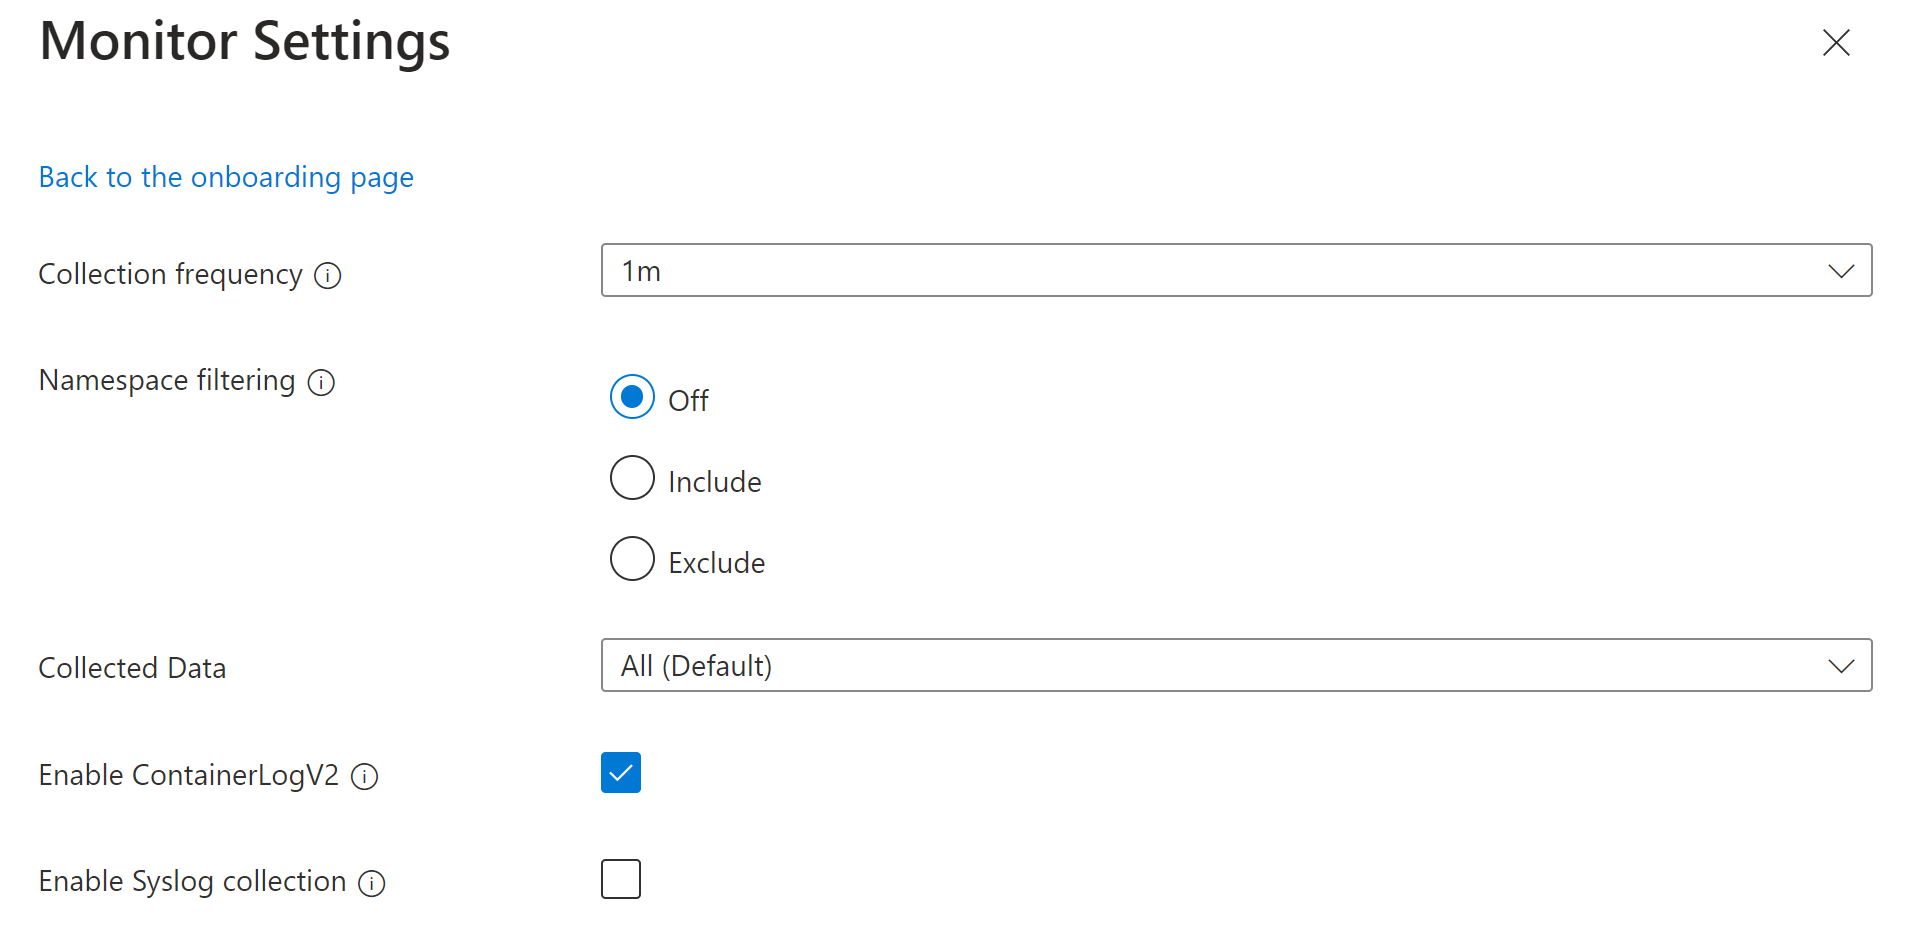
If you want to customize the settings, click Edit collection settings. See Data collection parameters for details on each setting. For Collected data, see Collected data below.
Click Configure to save the settings.


Cost presets
When you use the Azure portal to configure cost optimization, you can select from the following preset configurations. You can select one of these or provide your own customized settings. By default, Container insights uses the Standard preset.
| Cost preset | Collection frequency | Namespace filters | Syslog collection | Collected data |
|---|---|---|---|---|
| Standard | 1 m | None | Not enabled | All standard container insights tables |
| Cost-optimized | 5 m | Excludes kube-system, gatekeeper-system, azure-arc | Not enabled | All standard container insights tables |
| Syslog | 1 m | None | Enabled by default | All standard container insights tables |
| Logs and Events | 1 m | None | Not enabled | ContainerLog/ContainerLogV2 KubeEvents KubePodInventory |
Collected data
The Collected data option allows you to select the tables that are populated for the cluster. This is the equivalent of the streams parameter when performing the configuration with CLI or ARM. If you select any option other than All (Default), the Container insights experience becomes unavailable, and you must use Grafana or other methods to analyze collected data.

| Grouping | Tables | Notes |
|---|---|---|
| All (Default) | All standard container insights tables | Required for enabling the default Container insights visualizations |
| Performance | Perf, InsightsMetrics | |
| Logs and events | ContainerLog or ContainerLogV2, KubeEvents, KubePodInventory | Recommended if you have enabled managed Prometheus metrics |
| Workloads, Deployments, and HPAs | InsightsMetrics, KubePodInventory, KubeEvents, ContainerInventory, ContainerNodeInventory, KubeNodeInventory, KubeServices | |
| Persistent Volumes | InsightsMetrics, KubePVInventory |
Data collection parameters
The following table describes the supported data collection settings and the name used for each for different onboarding options.
| Name | Description |
|---|---|
| Collection frequency CLI: intervalARM: dataCollectionInterval |
Determines how often the agent collects data. Valid values are 1m - 30m in 1m intervals The default value is 1m. If the value is outside the allowed range, then it defaults to 1 m. |
| Namespace filtering CLI: namespaceFilteringModeARM: namespaceFilteringModeForDataCollection |
Include: Collects only data from the values in the namespaces field. Exclude: Collects data from all namespaces except for the values in the namespaces field. Off: Ignores any namespace selections and collect data on all namespaces. |
| Namespace filtering CLI: namespacesARM: namespacesForDataCollection |
Array of comma separated Kubernetes namespaces to collect inventory and perf data based on the namespaceFilteringMode. For example, namespaces = ["kube-system", "default"] with an Include setting collects only these two namespaces. With an Exclude setting, the agent collects data from all other namespaces except for kube-system and default. With an Off setting, the agent collects data from all namespaces including kube-system and default. Invalid and unrecognized namespaces are ignored. |
| Enable ContainerLogV2 CLI: enableContainerLogV2ARM: enableContainerLogV2 |
Boolean flag to enable ContainerLogV2 schema. If set to true, the stdout/stderr Logs are ingested to ContainerLogV2 table. If not, the container logs are ingested to ContainerLog table, unless otherwise specified in the ConfigMap. When specifying the individual streams, you must include the corresponding table for ContainerLog or ContainerLogV2. |
| Collected Data CLI: streamsARM: streams |
An array of container insights table streams. See the supported streams above to table mapping. |
Applicable tables and metrics
The settings for collection frequency and namespace filtering don't apply to all Container insights data. The following tables list the tables in the Log Analytics workspace used by Container insights and the metrics it collects along with the settings that apply to each.
Note
This feature configures settings for all container insights tables except for ContainerLog and ContainerLogV2. To configure settings for these tables, update the ConfigMap described in agent data collection settings.
| Table name | Interval? | Namespaces? | Remarks |
|---|---|---|---|
| ContainerInventory | Yes | Yes | |
| ContainerNodeInventory | Yes | No | Data collection setting for namespaces isn't applicable since Kubernetes Node isn't a namespace scoped resource |
| KubeNodeInventory | Yes | No | Data collection setting for namespaces isn't applicable Kubernetes Node isn't a namespace scoped resource |
| KubePodInventory | Yes | Yes | |
| KubePVInventory | Yes | Yes | |
| KubeServices | Yes | Yes | |
| KubeEvents | No | Yes | Data collection setting for interval isn't applicable for the Kubernetes Events |
| Perf | Yes | Yes | Data collection setting for namespaces isn't applicable for the Kubernetes Node related metrics since the Kubernetes Node isn't a namespace scoped object. |
| InsightsMetrics | Yes | Yes | Data collection settings are only applicable for the metrics collecting the following namespaces: container.azm.ms/kubestate, container.azm.ms/pv and container.azm.ms/gpu |
| Metric namespace | Interval? | Namespaces? | Remarks |
|---|---|---|---|
| Insights.container/nodes | Yes | No | Node isn't a namespace scoped resource |
| Insights.container/pods | Yes | Yes | |
| Insights.container/containers | Yes | Yes | |
| Insights.container/persistentvolumes | Yes | Yes |
Stream values
When you specify the tables to collect using CLI or ARM, you specify a stream name that corresponds to a particular table in the Log Analytics workspace. The following table lists the stream name for each table.
Note
If you're familiar with the structure of a data collection rule, the stream names in this table are specified in the dataFlows section of the DCR.
| Stream | Container insights table |
|---|---|
| Microsoft-ContainerInventory | ContainerInventory |
| Microsoft-ContainerLog | ContainerLog |
| Microsoft-ContainerLogV2 | ContainerLogV2 |
| Microsoft-ContainerNodeInventory | ContainerNodeInventory |
| Microsoft-InsightsMetrics | InsightsMetrics |
| Microsoft-KubeEvents | KubeEvents |
| Microsoft-KubeMonAgentEvents | KubeMonAgentEvents |
| Microsoft-KubeNodeInventory | KubeNodeInventory |
| Microsoft-KubePodInventory | KubePodInventory |
| Microsoft-KubePVInventory | KubePVInventory |
| Microsoft-KubeServices | KubeServices |
| Microsoft-Perf | Perf |
Impact on visualizations and alerts
If you're currently using the above tables for other custom alerts or charts, then modifying your data collection settings might degrade those experiences. If you're excluding namespaces or reducing data collection frequency, review your existing alerts, dashboards, and workbooks using this data.
To scan for alerts that reference these tables, run the following Azure Resource Graph query:
resources
| where type in~ ('microsoft.insights/scheduledqueryrules') and ['kind'] !in~ ('LogToMetric')
| extend severity = strcat("Sev", properties["severity"])
| extend enabled = tobool(properties["enabled"])
| where enabled in~ ('true')
| where tolower(properties["targetResourceTypes"]) matches regex 'microsoft.operationalinsights/workspaces($|/.*)?' or tolower(properties["targetResourceType"]) matches regex 'microsoft.operationalinsights/workspaces($|/.*)?' or tolower(properties["scopes"]) matches regex 'providers/microsoft.operationalinsights/workspaces($|/.*)?'
| where properties contains "Perf" or properties  contains "InsightsMetrics" or properties  contains "ContainerInventory" or properties  contains "ContainerNodeInventory" or properties  contains "KubeNodeInventory" or properties  contains"KubePodInventory" or properties  contains "KubePVInventory" or properties  contains "KubeServices" or properties  contains "KubeEvents"
| project id,name,type,properties,enabled,severity,subscriptionId
| order by tolower(name) asc
Next steps
- See Configure data collection in Container insights using ConfigMap to configure data collection using ConfigMap instead of the DCR.
Feedback
Coming soon: Throughout 2024 we will be phasing out GitHub Issues as the feedback mechanism for content and replacing it with a new feedback system. For more information see: https://aka.ms/ContentUserFeedback.
Submit and view feedback for