Troubleshoot pipeline runs
Azure DevOps Services | Azure DevOps Server 2022 - Azure DevOps Server 2019
If your pipeline run fails to complete, you can use the diagnostic information and logs provided by the pipeline run summary page to help troubleshoot the issue.

View logs
Select the error message to view the logs for the task that failed to complete.
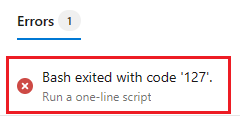
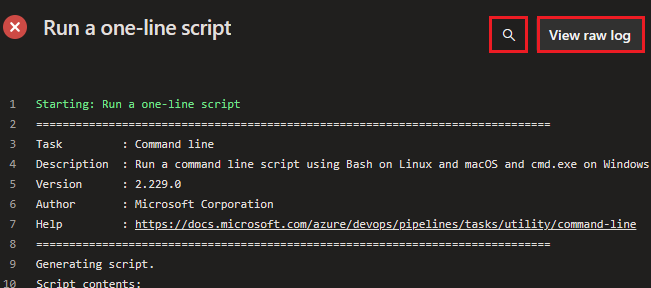
The logs page is displayed, with the error selected. In this example, there's an error in the cmd-line task, where the echo command is entered as ech.

You can view the raw log for the task by choosing View raw log, and you can search the log using Find.
Scan the logs of the failing task for error information and clues as to why the task is failing. By default, nonverbose logs are generated by a pipeline run. If the default logs don't indicate the cause of the issue, you can get more information by configuring verbose logs.
Error analysis page
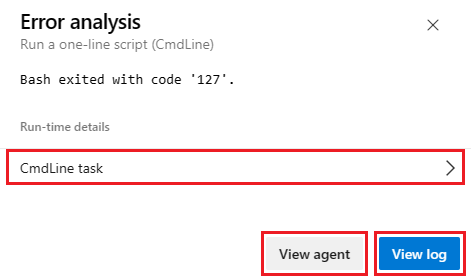
Troubleshooting assistance is available using the Error analysis page. Move the mouse over the error information line and choose the View analysis icon.
![]()
![]()
Choose View agent for self-hosted agents (or About hosted agent image for Microsoft-hosted agents) to view more information about the agent used to run the pipeline, and View log to view the pipeline run logs.
Choose the name of the task below Run-time details to view information about the task.
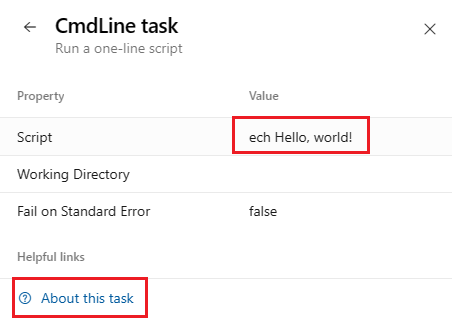
In this example, you can see that there's an error in the Value of the Script. Choose About this task to view the documentation for the task.
If the issue isn't apparent from the pipeline run summary page or browsing the logs, check the following Common issues section, and see Review logs to diagnose pipeline issues for information on downloading complete logs which include additional diagnostic information.
Common issues
- Job time-out
- Issues downloading code
- My pipeline is failing on a command-line step such as MSBUILD
- File or folder in use errors
- Intermittent or inconsistent MSBuild failures
- Process stops responding
- Line endings for multiple platforms
- Variables having ' (single quote) appended
- Service Connection related issues
- Pipeline stopped hearing from agent
Task insights for failed pipeline runs
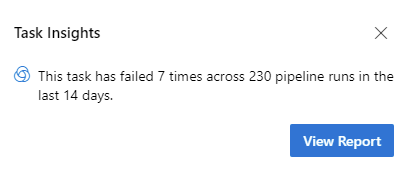
Azure DevOps provides a Task Insights for Failed Pipeline Runs setting, that when enabled, provides pop-up notifications of build failures with a link to view a report.
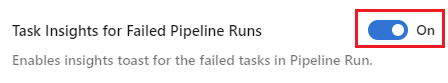
To configure this setting, navigate to Preview features, find Task Insights for Failed Pipeline Runs, and choose the desired setting.
Job time-out
A pipeline can run for a long time and then fail due to job time-out. Job timeout closely depends on the agent being used. Free Microsoft hosted agents have a max timeout of 60 minutes per job for a private repository and 360 minutes for a public repository. To increase the max timeout for a job, you can opt for any of the following.
- Buy a Microsoft hosted agent which will give you 360 minutes for all jobs, irrespective of the repository used
- Use a self-hosted agent to rule out any timeout issues due to the agent
Learn more about job timeout.
Note
If your Microsoft-hosted agent jobs are timing out, ensure that you haven't specified a pipeline timeout that is less than the max timeout for a job. To check, see Timeouts.
Issues downloading code
My pipeline is failing on a checkout step
If you're using a checkout step on an Azure Repos Git repository in your organization that is in a different project than your pipeline, ensure that the Limit job authorization scope to current project setting is disabled, or follow the steps in Scoped build identities to ensure that your pipeline has access to the repository.
When your pipeline can't access the repository due to limited job authorization scope, you will receive the error Git fetch failed with exit code 128 and your logs will contain an entry similar to Remote: TF401019: The Git repository with name or identifier <your repo name> does not exist or you do not have permissions for the operation you are attempting.
If your pipeline is failing immediately with Could not find a project that corresponds with the repository, ensure that your project and repository name are correct in the checkout step or the repository resource declaration.
Team Foundation Version Control (TFVC) issues
Get sources not downloading some files
This might be characterized by a message in the log "All files up to date" from the tf get command. Verify the built-in service identity has permission to download the sources. Either the identity Project Collection Build Service or Project Build Service will need permission to download the sources, depending on the selected authorization scope on General tab of the build pipeline. In the version control web UI, you can browse the project files at any level of the folder hierarchy and check the security settings.
Get sources through Team Foundation Proxy
The easiest way to configure the agent to get sources through a Team Foundation Proxy is set environment variable TFSPROXY that point to the TFVC proxy server for the agent's run as user.
Windows:
    set TFSPROXY=http://tfvcproxy:8081
    setx TFSPROXY=http://tfvcproxy:8081 // If the agent service is running as NETWORKSERVICE or any service account you can't easily set user level environment variable
macOS/Linux:
export TFSPROXY=http://tfvcproxy:8081
My pipeline is failing on a command-line step such as MSBUILD
It is helpful to narrow whether a build or release failure is the result of an Azure Pipelines/TFS product issue (agent or tasks). Build and release failures might also result from external commands.
Check the logs for the exact command-line executed by the failing task. Attempting to run the command locally from the command line might reproduce the issue. It can be helpful to run the command locally from your own machine, and/or sign in to the machine and run the command as the service account.
For example, is the problem happening during the MSBuild part of your build pipeline (for example, are you using either the MSBuild or Visual Studio Build task)? If so, then try running the same MSBuild command on a local machine using the same arguments. If you can reproduce the problem on a local machine, then your next steps are to investigate the MSBuild problem.
File layout
The location of tools, libraries, headers, and other things needed for a build might be different on the hosted agent than from your local machine. If a build fails because it can't find one of these files, you can use the below scripts to inspect the layout on the agent. This might help you track down the missing file.
Create a new YAML pipeline in a temporary location (e.g. a new repo created for the purpose of troubleshooting).
As written, the script searches directories on your path.
You can optionally edit the SEARCH_PATH= line to search other places.
# Script for Linux and macOS
pool: { vmImage: ubuntu-latest } # or whatever pool you use
steps:
- checkout: none
- bash: |
    SEARCH_PATH=$PATH  # or any colon-delimited list of paths
    IFS=':' read -r -a PathDirs <<< "$SEARCH_PATH"
    echo "##[debug] Found directories"
    for element in "${PathDirs[@]}"; do
        echo "$element"
    done;
    echo;
    echo;
    echo "##[debug] Found files"
    for element in "${PathDirs[@]}"; do
        find "$element" -type f
    done
# Script for Windows
pool: { vmImage: windows-2019 } # or whatever pool you use
steps:
- checkout: none
- powershell: |
    $SEARCH_PATH=$Env:Path
    Write-Host "##[debug] Found directories"
    ForEach ($Dir in $SEARCH_PATH -split ";") {
      Write-Host "$Dir"
    }
    Write-Host ""
    Write-Host ""
    Write-Host "##[debug] Found files"
    ForEach ($Dir in $SEARCH_PATH -split ";") {
      Get-ChildItem $Dir -File -ErrorAction Continue | ForEach-Object -Process {
        Write-Host $_.FullName
      }
    }
Differences between local command prompt and agent
Keep in mind, some differences are in effect when executing a command on a local machine and when a build or release is running on an agent. If the agent is configured to run as a service on Linux, macOS, or Windows, then it is not running within an interactive logged-on session. Without an interactive logged-on session, UI interaction and other limitations exist.
File or folder in use errors
File or folder in use errors are often indicated by error messages such as:
Access to the path [...] is denied.The process cannot access the file [...] because it is being used by another process.Access is denied.Can't move [...] to [...]
Troubleshooting steps:
- Detect files and folders in use
- Anti-virus exclusion
- MSBuild and /nodeReuse:false
- MSBuild and /maxcpucount:[n]
Detect files and folders in use
On Windows, tools like Process Monitor can be to capture a trace of file events under a specific directory. Or, for a snapshot in time, tools like Process Explorer or Handle can be used.
Anti-virus exclusion
Anti-virus software scanning your files can cause file or folder in use errors during a build or release. Adding an anti-virus exclusion for your agent directory and configured "work folder" can help to identify anti-virus software as the interfering process.
MSBuild and /nodeReuse:false
If you invoke MSBuild during your build, make sure to pass the argument /nodeReuse:false (short form /nr:false). Otherwise MSBuild processes will remain running after the build completes. The processes remain for some time in anticipation of a potential subsequent build.
This feature of MSBuild can interfere with attempts to delete or move a directory - due to a conflict with the working directory of the MSBuild process(es).
The MSBuild and Visual Studio Build tasks already add /nr:false to the arguments passed to MSBuild. However, if you invoke MSBuild from your own script, then you would need to specify the argument.
MSBuild and /maxcpucount:[n]
By default the build tasks such as MSBuild and Visual Studio Build run MSBuild with the /m switch. In some cases this can cause problems such as multiple process file access issues.
Try adding the /m:1 argument to your build tasks to force MSBuild to run only one process at a time.
File-in-use issues might result when leveraging the concurrent-process feature of MSBuild. Not specifying the argument /maxcpucount:[n] (short form /m:[n]) instructs MSBuild to use a single process only. If you are using the MSBuild or Visual Studio Build tasks, you might need to specify "/m:1" to override the "/m" argument that is added by default.
Intermittent or inconsistent MSBuild failures
If you're experiencing intermittent or inconsistent MSBuild failures, try instructing MSBuild to use a single-process only. Intermittent or inconsistent errors might indicate that your target configuration is incompatible with the concurrent-process feature of MSBuild. See MSBuild and /maxcpucount:[n].
Process stops responding
Process stops responding causes and troubleshooting steps:
Waiting for Input
A process that stops responding might indicate that a process is waiting for input.
Running the agent from the command line of an interactive logged on session might help to identify whether a process is prompting with a dialog for input.
Running the agent as a service might help to eliminate programs from prompting for input. For example in .NET, programs might rely on the System.Environment.UserInteractive Boolean to determine whether to prompt. When the agent is running as a Windows service, the value is false.
Process dump
Analyzing a dump of the process can help to identify what a deadlocked process is waiting on.
WiX project
Building a WiX project when custom MSBuild loggers are enabled, can cause WiX to deadlock waiting on the output stream. Adding the additional MSBuild argument /p:RunWixToolsOutOfProc=true will work around the issue.
Line endings for multiple platforms
When you run pipelines on multiple platforms, you can sometimes encounter problems with different line endings. Historically, Linux and macOS used linefeed (LF) characters while Windows used a carriage return plus a linefeed (CRLF). Git tries to compensate for the difference by automatically making lines end in LF in the repo but CRLF in the working directory on Windows.
Most Windows tools are fine with LF-only endings, and this automatic behavior can cause more problems than it solves.
If you encounter issues based on line endings, we recommend you configure Git to prefer LF everywhere.
To do this, add a .gitattributes file to the root of your repository.
In that file, add the following line:
* text eol=lf
Variables having ' (single quote) appended
If your pipeline includes a Bash script that sets variables using the ##vso command, you might see an additional ' appended to the value of the variable you set.
This occurs because of an interaction with set -x.
The solution is to disable set -x temporarily before setting a variable.
The Bash syntax for doing that is set +x.
set +x
echo ##vso[task.setvariable variable=MY_VAR]my_value
set -x
Why does this happen?
Many Bash scripts include the set -x command to assist with debugging.
Bash will trace exactly what command was executed and echo it to stdout.
This will cause the agent to see the ##vso command twice, and the second time, Bash will have added the ' character to the end.
For instance, consider this pipeline:
steps:
- bash: |
    set -x
    echo ##vso[task.setvariable variable=MY_VAR]my_value
On stdout, the agent will see two lines:
##vso[task.setvariable variable=MY_VAR]my_value
+ echo '##vso[task.setvariable variable=MY_VAR]my_value'
When the agent sees the first line, MY_VAR will be set to the correct value, "my_value".
However, when it sees the second line, the agent will process everything to the end of the line.
MY_VAR will be set to "my_value'".
Libraries aren't installed for Python application when script executes
When a Python application is deployed, in some cases, a CI/CD pipeline runs and the code is deployed successfully, but the requirements.txt file that's responsible for installing all dependency libraries doesn't execute.
To install the dependencies, use a post-deployment script in the App Service deployment task. The following example shows the command you must use in the post-deployment script. You can update the script for your scenario.
D:\home\python364x64\python.exe -m pip install -r requirements.txt
Service Connection related issues
To troubleshoot issues related to service connections, see Service connection troubleshooting.
Pipeline stopped hearing from agent
If your pipeline fails with a message like We stopped hearing from agent <agent name>. Verify the agent machine is running and has a healthy network connection., check the resource utilization of the agent to see if the agent machine is running out of resources. Starting with Sprint 228, Azure Pipelines logs contain resource utilization metrics for each step.
When using Azure DevOps Services, you can see resource utilization in the logs, including disk usage, memory usage, and CPU utilization, by enabling verbose logs. When the pipeline completes, search the logs for Agent environment resources entries for each step.
2024-02-28T17:41:15.1315148Z ##[debug]Agent environment resources - Disk: D:\ Available 12342.00 MB out of 14333.00 MB, Memory: Used 1907.00 MB out of 7167.00 MB, CPU: Usage 17.23%
For information on capturing additional resource utilization logs, see Capture resource utilization details.
Enable Storage Explorer to deploy static content like .css and .js to a static website from Azure DevOps via Azure Pipelines
In this scenario, you can use the Azure File Copy task to upload content to the website. You can use any of the tools described in Uploading content to upload content to the web container.
Next steps
Feedback
Coming soon: Throughout 2024 we will be phasing out GitHub Issues as the feedback mechanism for content and replacing it with a new feedback system. For more information see: https://aka.ms/ContentUserFeedback.
Submit and view feedback for