Note
Access to this page requires authorization. You can try signing in or changing directories.
Access to this page requires authorization. You can try changing directories.
This notebook demonstrates how to analyze log data using a custom library with Apache Spark on HDInsight. The custom library we use is a Python library called iislogparser.py.
Prerequisites
An Apache Spark cluster on HDInsight. For instructions, see Create Apache Spark clusters in Azure HDInsight.
Save raw data as an RDD
In this section, we use the Jupyter Notebook associated with an Apache Spark cluster in HDInsight to run jobs that process your raw sample data and save it as a Hive table. The sample data is a .csv file (hvac.csv) available on all clusters by default.
Once your data is saved as an Apache Hive table, in the next section we'll connect to the Hive table using BI tools such as Power BI and Tableau.
From a web browser, navigate to
https://CLUSTERNAME.azurehdinsight.net/jupyter, whereCLUSTERNAMEis the name of your cluster.Create a new notebook. Select New, and then PySpark.
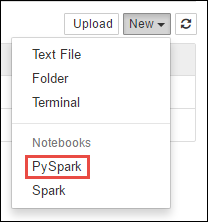 Notebook" border="true":::
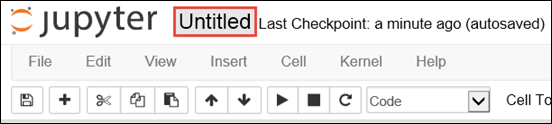
A new notebook is created and opened with the name Untitled.pynb. Select the notebook name at the top, and enter a friendly name.
Because you created a notebook using the PySpark kernel, you don't need to create any contexts explicitly. The Spark and Hive contexts will be automatically created for you when you run the first code cell. You can start by importing the types that are required for this scenario. Paste the following snippet in an empty cell, and then press Shift + Enter.
from pyspark.sql import Row
from pyspark.sql.types import *
Create an RDD using the sample log data already available on the cluster. You can access the data in the default storage account associated with the cluster at
\HdiSamples\HdiSamples\WebsiteLogSampleData\SampleLog\909f2b.log. Execute the following code:logs = sc.textFile('wasbs:///HdiSamples/HdiSamples/WebsiteLogSampleData/SampleLog/909f2b.log')Retrieve a sample log set to verify that the previous step completed successfully.
logs.take(5)You should see an output similar to the following text:
[u'#Software: Microsoft Internet Information Services 8.0',
u'#Fields: date time s-sitename cs-method cs-uri-stem cs-uri-query s-port cs-username c-ip cs(User-Agent) cs(Cookie) cs(Referer) cs-host sc-status sc-substatus sc-win32-status sc-bytes cs-bytes time-taken',
u'2014-01-01 02:01:09 SAMPLEWEBSITE GET /blogposts/mvc4/step2.png X-ARR-LOG-ID=2ec4b8ad-3cf0-4442-93ab-837317ece6a1 80 - 1.54.23.196 Mozilla/5.0+(Windows+NT+6.3;+WOW64)+AppleWebKit/537.36+(KHTML,+like+Gecko)+Chrome/31.0.1650.63+Safari/537.36 - http://weblogs.asp.net/sample/archive/2007/12/09/asp-net-mvc-framework-part-4-handling-form-edit-and-post-scenarios.aspx www.sample.com 200 0 0 53175 871 46',
u'2014-01-01 02:01:09 SAMPLEWEBSITE GET /blogposts/mvc4/step3.png X-ARR-LOG-ID=9eace870-2f49-4efd-b204-0d170da46b4a 80 - 1.54.23.196 Mozilla/5.0+(Windows+NT+6.3;+WOW64)+AppleWebKit/537.36+(KHTML,+like+Gecko)+Chrome/31.0.1650.63+Safari/537.36 - http://weblogs.asp.net/sample/archive/2007/12/09/asp-net-mvc-framework-part-4-handling-form-edit-and-post-scenarios.aspx www.sample.com 200 0 0 51237 871 32',
u'2014-01-01 02:01:09 SAMPLEWEBSITE GET /blogposts/mvc4/step4.png X-ARR-LOG-ID=4bea5b3d-8ac9-46c9-9b8c-ec3e9500cbea 80 - 1.54.23.196 Mozilla/5.0+(Windows+NT+6.3;+WOW64)+AppleWebKit/537.36+(KHTML,+like+Gecko)+Chrome/31.0.1650.63+Safari/537.36 - http://weblogs.asp.net/sample/archive/2007/12/09/asp-net-mvc-framework-part-4-handling-form-edit-and-post-scenarios.aspx www.sample.com 200 0 0 72177 871 47']
Analyze log data using a custom Python library
In the output above, the first couple lines include the header information and each remaining line matches the schema described in that header. Parsing such logs could be complicated. So, we use a custom Python library (iislogparser.py) that makes parsing such logs much easier. By default, this library is included with your Spark cluster on HDInsight at
/HdiSamples/HdiSamples/WebsiteLogSampleData/iislogparser.py.However, this library isn't in the
PYTHONPATHso we can't use it by using an import statement likeimport iislogparser. To use this library, we must distribute it to all the worker nodes. Run the following snippet.sc.addPyFile('wasbs:///HdiSamples/HdiSamples/WebsiteLogSampleData/iislogparser.py')iislogparserprovides a functionparse_log_linethat returnsNoneif a log line is a header row, and returns an instance of theLogLineclass if it encounters a log line. Use theLogLineclass to extract only the log lines from the RDD:def parse_line(l): import iislogparser return iislogparser.parse_log_line(l) logLines = logs.map(parse_line).filter(lambda p: p is not None).cache()Retrieve a couple of extracted log lines to verify that the step completed successfully.
logLines.take(2)The output should be similar to the following text:
[2014-01-01 02:01:09 SAMPLEWEBSITE GET /blogposts/mvc4/step2.png X-ARR-LOG-ID=2ec4b8ad-3cf0-4442-93ab-837317ece6a1 80 - 1.54.23.196 Mozilla/5.0+(Windows+NT+6.3;+WOW64)+AppleWebKit/537.36+(KHTML,+like+Gecko)+Chrome/31.0.1650.63+Safari/537.36 - http://weblogs.asp.net/sample/archive/2007/12/09/asp-net-mvc-framework-part-4-handling-form-edit-and-post-scenarios.aspx www.sample.com 200 0 0 53175 871 46,
2014-01-01 02:01:09 SAMPLEWEBSITE GET /blogposts/mvc4/step3.png X-ARR-LOG-ID=9eace870-2f49-4efd-b204-0d170da46b4a 80 - 1.54.23.196 Mozilla/5.0+(Windows+NT+6.3;+WOW64)+AppleWebKit/537.36+(KHTML,+like+Gecko)+Chrome/31.0.1650.63+Safari/537.36 - http://weblogs.asp.net/sample/archive/2007/12/09/asp-net-mvc-framework-part-4-handling-form-edit-and-post-scenarios.aspx www.sample.com 200 0 0 51237 871 32]
The
LogLineclass, in turn, has some useful methods, likeis_error(), which returns whether a log entry has an error code. Use this class to compute the number of errors in the extracted log lines, and then log all the errors to a different file.errors = logLines.filter(lambda p: p.is_error()) numLines = logLines.count() numErrors = errors.count() print 'There are', numErrors, 'errors and', numLines, 'log entries' errors.map(lambda p: str(p)).saveAsTextFile('wasbs:///HdiSamples/HdiSamples/WebsiteLogSampleData/SampleLog/909f2b-2.log')The output should state
There are 30 errors and 646 log entries.You can also use Matplotlib to construct a visualization of the data. For example, if you want to isolate the cause of requests that run for a long time, you might want to find the files that take the most time to serve on average. The snippet below retrieves the top 25 resources that took most time to serve a request.
def avgTimeTakenByKey(rdd):
    return rdd.combineByKey(lambda line: (line.time_taken, 1),
                            lambda x, line: (x[0] + line.time_taken, x[1] + 1),
                            lambda x, y: (x[0] + y[0], x[1] + y[1]))\
                .map(lambda x: (x[0], float(x[1][0]) / float(x[1][1])))

avgTimeTakenByKey(logLines.map(lambda p: (p.cs_uri_stem, p))).top(25, lambda x: x[1])
You should see an output like the following text:
[(u'/blogposts/mvc4/step13.png', 197.5),
(u'/blogposts/mvc2/step10.jpg', 179.5),
(u'/blogposts/extractusercontrol/step5.png', 170.0),
(u'/blogposts/mvc4/step8.png', 159.0),
(u'/blogposts/mvcrouting/step22.jpg', 155.0),
(u'/blogposts/mvcrouting/step3.jpg', 152.0),
(u'/blogposts/linqsproc1/step16.jpg', 138.75),
(u'/blogposts/linqsproc1/step26.jpg', 137.33333333333334),
(u'/blogposts/vs2008javascript/step10.jpg', 127.0),
(u'/blogposts/nested/step2.jpg', 126.0),
(u'/blogposts/adminpack/step1.png', 124.0),
(u'/BlogPosts/datalistpaging/step2.png', 118.0),
(u'/blogposts/mvc4/step35.png', 117.0),
(u'/blogposts/mvcrouting/step2.jpg', 116.5),
(u'/blogposts/aboutme/basketball.jpg', 109.0),
(u'/blogposts/anonymoustypes/step11.jpg', 109.0),
(u'/blogposts/mvc4/step12.png', 106.0),
(u'/blogposts/linq8/step0.jpg', 105.5),
(u'/blogposts/mvc2/step18.jpg', 104.0),
(u'/blogposts/mvc2/step11.jpg', 104.0),
(u'/blogposts/mvcrouting/step1.jpg', 104.0),
(u'/blogposts/extractusercontrol/step1.png', 103.0),
(u'/blogposts/sqlvideos/sqlvideos.jpg', 102.0),
(u'/blogposts/mvcrouting/step21.jpg', 101.0),
(u'/blogposts/mvc4/step1.png', 98.0)]
You can also present this information in the form of plot. As a first step to create a plot, let us first create a temporary table AverageTime. The table groups the logs by time to see if there were any unusual latency spikes at any particular time.
avgTimeTakenByMinute = avgTimeTakenByKey(logLines.map(lambda p: (p.datetime.minute, p))).sortByKey()
schema = StructType([StructField('Minutes', IntegerType(), True),
                    StructField('Time', FloatType(), True)])

avgTimeTakenByMinuteDF = sqlContext.createDataFrame(avgTimeTakenByMinute, schema)
avgTimeTakenByMinuteDF.registerTempTable('AverageTime')
You can then run the following SQL query to get all the records in the AverageTime table.
%%sql -o averagetime
SELECT * FROM AverageTime
The
%%sqlmagic followed by-o averagetimeensures that the output of the query is persisted locally on the Jupyter server (typically the headnode of the cluster). The output is persisted as a Pandas dataframe with the specified name averagetime.You should see an output like the following image:
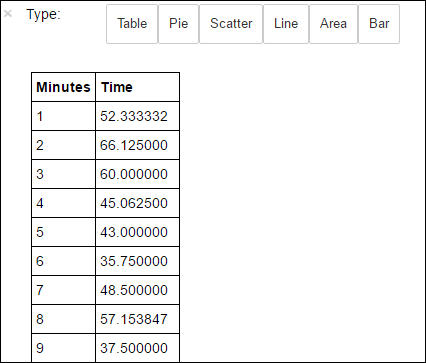 yter sql query output" border="true":::
For more information about the
%%sqlmagic, see Parameters supported with the %%sql magic.You can now use Matplotlib, a library used to construct visualization of data, to create a plot. Because the plot must be created from the locally persisted averagetime dataframe, the code snippet must begin with the
%%localmagic. This ensures that the code is run locally on the Jupyter server.%%local %matplotlib inline import matplotlib.pyplot as plt plt.plot(averagetime['Minutes'], averagetime['Time'], marker='o', linestyle='--') plt.xlabel('Time (min)') plt.ylabel('Average time taken for request (ms)')You should see an output like the following image:
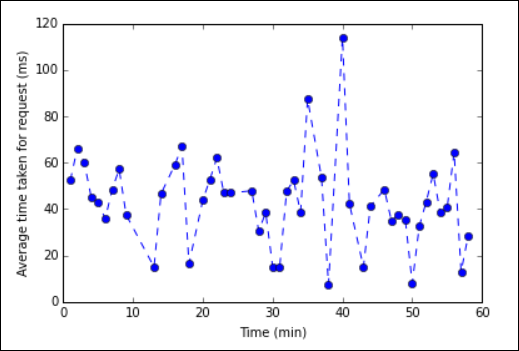 eb log analysis plot" border="true":::
After you have finished running the application, you should shut down the notebook to release the resources. To do so, from the File menu on the notebook, select Close and Halt. This action will shut down and close the notebook.
Next steps
Explore the following articles: