Understand paginated report data in Power BI Report Builder
APPLIES TO: ![]() Power BI Report Builder
Power BI Report Builder ![]() Power BI Desktop
Power BI Desktop
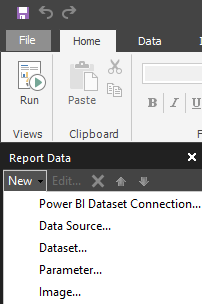
Paginated report data can come from multiple sources of data in your organization. Your first step in designing a Power BI Report Builder paginated report is to create data sources and datasets that represent the underlying report data.
Each data source includes data connection information. Each dataset includes a query command that defines the set of fields to use as data from a data source. To visualize data from each dataset, add a data region, such as a table, matrix, chart, or map. When the report is processed, the queries run on the data source, and each data region expands as needed to display the query results for the dataset.
Learn how to Create an embedded data source for paginated reports in Power BI Report Builder.
For a list of available data sources, see Supported data sources for Power BI paginated reports.
Terms
Data connection. Also known as a data source. A data connection includes a name and connection properties that are dependent on the connection type. By design, a data connection doesn't include credentials. A data connection doesn't specify which data to retrieve from the external data source. To do that, you specify a query when you create a dataset.
Connection string. A connection string is a string version of the connection properties that are needed to connect to a data source. Connection properties differ based on data connection type.
Note
Data source connection strings can't be expression-based.
Embedded data source. Also known as a report-specific data source. A data source that's defined in a report and used only by that report.
Credentials. Credentials are the authentication information that must be provided to allow you access to external data.
Tips for specifying report data
Use the following information to design your report data strategy.
Filter data. Report data can be filtered in the query or in the report. You can use datasets and query variables to create cascading parameters, and provide a user with the ability to narrow thousands of selections to a more manageable number of choices. You can filter data in a table or chart based on parameter values or other values that you specify.
Parameters. Dataset query commands that include query variables automatically create matching report parameters. You can also manually create parameters. When you view a report, the report toolbar displays the parameters. Users can select values to control report data or report appearance. To customize report data for specific audiences, you can create sets of report parameters with different default values linked to the same report definition, or use the built-in UserID field.
Group and aggregate data. Report data can be grouped and aggregated in the query or in the report. If you aggregate values in the query, you can continue to combine values in the report within the constraints of what is meaningful.
Sort data. Report data can be sorted in the query or in the report. In tables, you can also add an interactive sort button to let the user control the sort order.
Expression-based data. You can write powerful expressions to control report data and appearance. Most report properties can be expression based, and expressions can include references to dataset fields and report parameters. You can provide a user with the ability to control the data they see by defining parameters.
Display data from a dataset. Data from a dataset is typically displayed on one or more data regions, for example, a table and a chart.
Display data from multiple datasets. You can write expressions in a data region, based on one dataset, that look up values or aggregates in other datasets. You can include subreports in a table based on one dataset to display data from a different data source.
Use the following list to help define sources of data for a report.
Understand the software data layer architecture for your organization and the potential issues that arise from data types. Understand how data extensions and data processing extensions can affect query results. Data types differ among the source of data, data providers, and the data types stored in the report definition language (.rdl) file.
Data sources and datasets are authored in a report and published to the Power BI service. After they're published, you can configure credentials directly in the Power BI service or in your Enterprise Gateway.
Related content
Feedback
Coming soon: Throughout 2024 we will be phasing out GitHub Issues as the feedback mechanism for content and replacing it with a new feedback system. For more information see: https://aka.ms/ContentUserFeedback.
Submit and view feedback for