Azure Communication Services currently provides metrics for all Communication Services primitives. You can use Azure Monitor metrics explorer to:
Plot your own charts.
Investigate abnormalities in your metric values.
Understand your API traffic by using the metrics data that Chat requests emit.
Where to find metrics
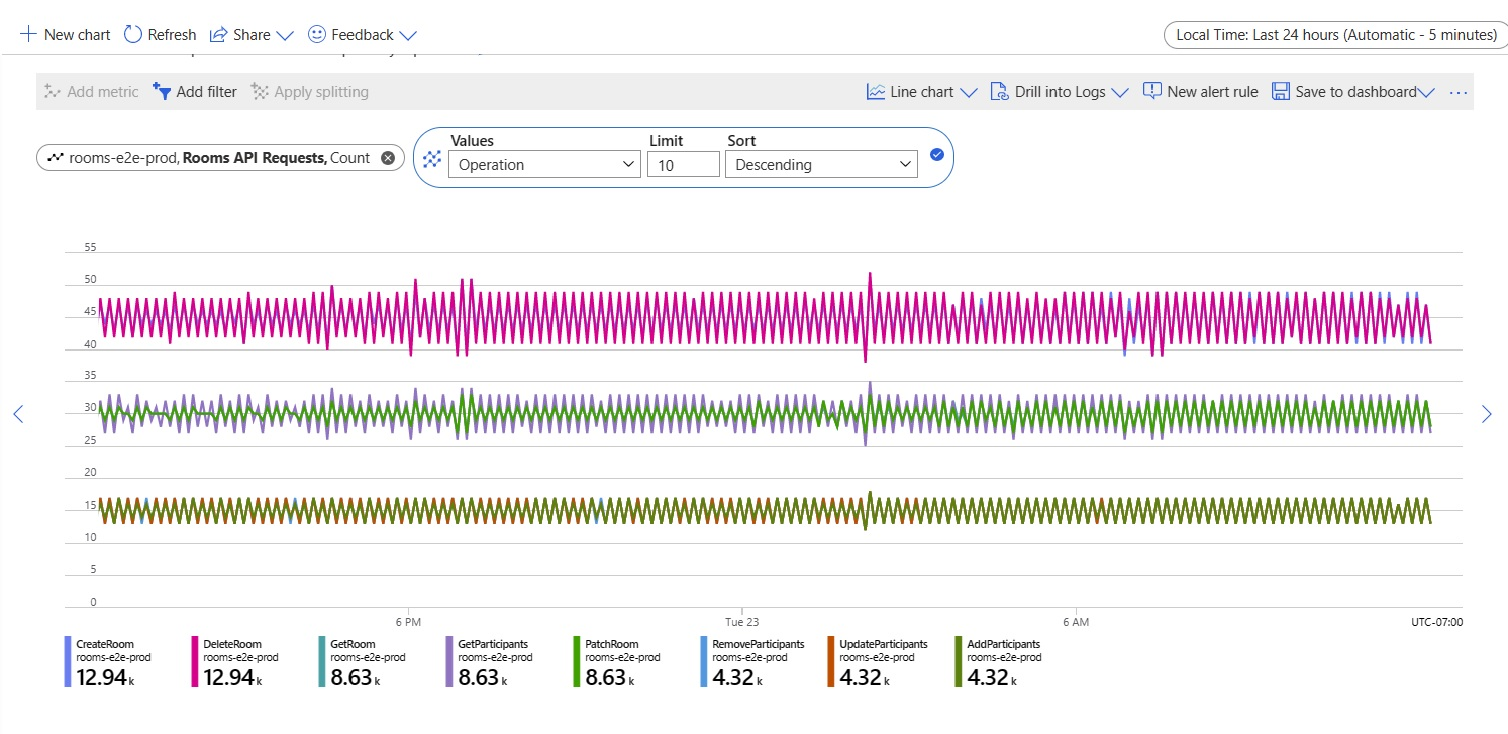
Primitives in Communication Services emit metrics for API requests. To find these metrics, see the Metrics tab under your Communication Services resource. You can also create permanent dashboards by using the workbooks tab under your Communication Services resource.
Metric definitions
All API request metrics contain three dimensions that you can use to filter your metrics data. These dimensions can be aggregated together by using the Count aggregation type. They support all standard Azure Aggregation time series, including Sum, Average, Min, and Max.