Connect to data sources in Power BI Desktop
With Power BI Desktop, you can easily connect to the ever expanding world of data. If you don’t have Power BI Desktop, you can download and install it.
There are all sorts of data sources available in Power BI Desktop. The following image shows how to connect to data, by selecting Get data > Other > Web.
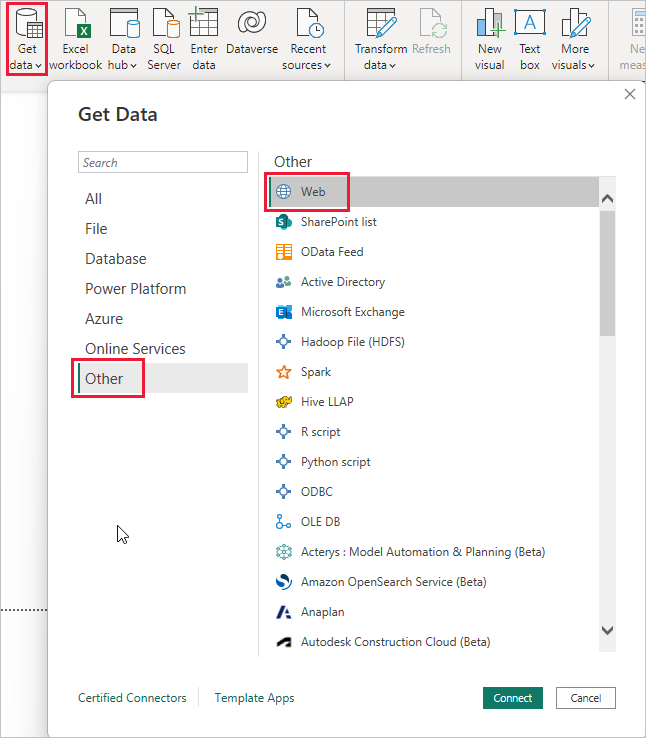
Example of connecting to data
For this example, we'll connect to a Web data source.
Imagine you’re retiring. You want to live where there’s lots of sunshine, preferable taxes, and good health care. Or… perhaps you’re a data analyst, and you want that information to help your customers, as in, help your raincoat manufacturing client target sales where it rains a lot.
Either way, you find a Web resource that has interesting data about those topics, and more:
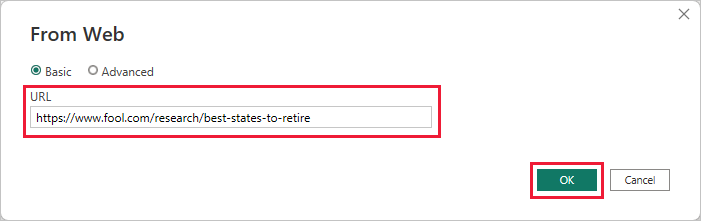
https://www.fool.com/research/best-states-to-retire
Select Get data > Other > Web. In From Web, enter the address.
When you select OK, the Query functionality of Power BI Desktop goes to work. Power BI Desktop contacts the Web resource, and the Navigator window returns the results of what it found on that Web page. In this case, it found a table. We're interested in that table, so we select it from the list. The Navigator window displays a preview.

At this point, you can edit the query before loading the table, by selecting Transform Data from the bottom of the window, or just load the table.
Select Transform Data to load the table and launch Power Query Editor. The Query Settings pane is displayed. If it's not, select View from the ribbon, then choose Query Settings to display the Query Settings pane. Here’s what the editor looks like.

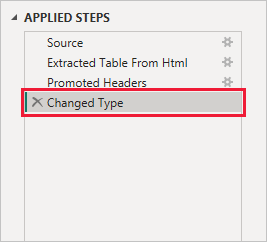
All those scores are text rather than numbers, and we need them to be numbers. No problem. Just right-click the column header, and select Change Type > Whole Number to change them. To choose more than one column, first select a column then choose Shift, select other adjacent columns, and then right-click a column header to change all selected columns. Use Ctrl to choose columns that aren't adjacent.

In Query Settings, the APPLIED STEPS reflect any changes that were made. As you make more changes to the data, Power Query Editor records those changes in the APPLIED STEPS section, which you can adjust, revisit, rearrange, or delete as necessary.
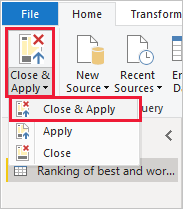
Other changes to the table can still be made after it's loaded, but for now these changes are enough. When you're done, select Close & Apply from the Home ribbon, and Power BI Desktop applies the changes and closes Power Query Editor.
With the data model loaded, in Report view in Power BI Desktop, you can begin creating visualizations by dragging fields onto the canvas.

Of course, this model is simple, with a single data connection. Most Power BI Desktop reports have connections to different data sources, shaped to meet your needs, with relationships that produce a rich data model.
Related content
There are all sorts of things you can do with Power BI Desktop. For more information on its capabilities, check out the following resources:
- What is Power BI Desktop?
- Query overview in Power BI Desktop
- Data sources in Power BI Desktop
- Shape and combine data in Power BI Desktop
- Perform common query tasks in Power BI Desktop
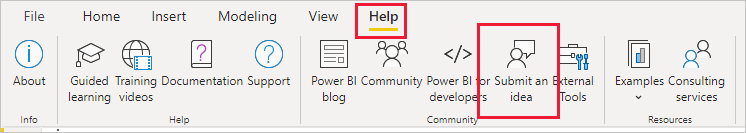
Want to give us feedback? Great! Use the Submit an Idea menu item in Power BI Desktop or visit Community Feedback. We look forward to hearing from you!
Feedback
Coming soon: Throughout 2024 we will be phasing out GitHub Issues as the feedback mechanism for content and replacing it with a new feedback system. For more information see: https://aka.ms/ContentUserFeedback.
Submit and view feedback for