Connect to SAP HANA data sources by using DirectQuery in Power BI
You can connect to SAP HANA data sources directly using DirectQuery. There are two options when connecting to SAP HANA:
Treat SAP HANA as a multi-dimensional source (default): In this case, the behavior is similar to when Power BI connects to other multi-dimensional sources like SAP Business Warehouse, or Analysis Services. When you connect to SAP HANA using this setting, a single analytic or calculation view is selected and all the measures, hierarchies and attributes of that view are available in the field list. As visuals are created, the aggregate data is always retrieved from SAP HANA. This technique is the recommended approach, and is the default for new DirectQuery reports over SAP HANA.
Treat SAP HANA as a relational source: In this case, Power BI treats SAP HANA as a relational source. This approach offers greater flexibility. Care must be taken with this approach to ensure that measures are aggregated as expected, and to avoid performance issues.
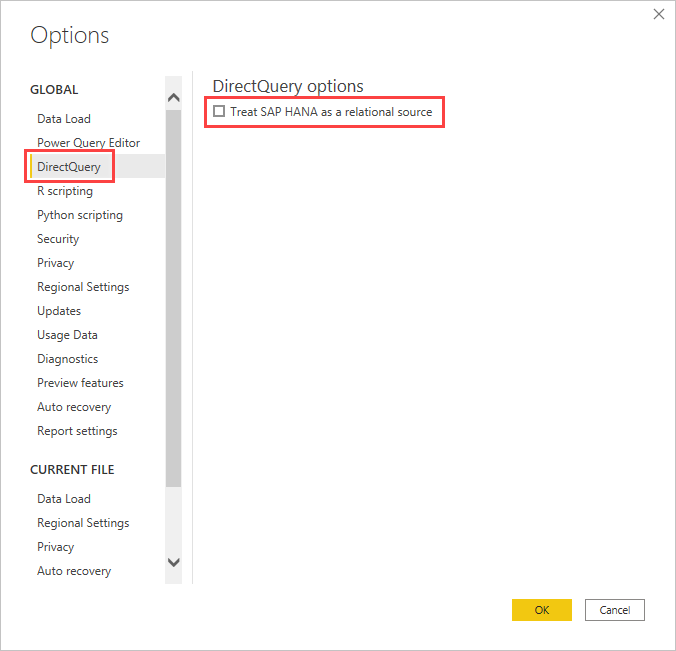
The connection approach is determined by a global tool option, which is set by selecting File > Options and settings and then Options > DirectQuery, then selecting the option Treat SAP HANA as a relational source, as shown in the following image.
The option to treat SAP HANA as a relational source controls the approach used for any new report using DirectQuery over SAP HANA. It has no effect on any existing SAP HANA connections in the current report, nor on connections in any other reports that are opened. So if the option is currently unchecked, then upon adding a new connection to SAP HANA using Get Data, that connection is made treating SAP HANA as a multi-dimensional source. However, if a different report is opened that also connects to SAP HANA, then that report continues to behave according to the option that was set at the time it was created. This fact means that any reports connecting to SAP HANA that were created prior to February 2018 continue to treat SAP HANA as a relational source.
The two approaches constitute different behavior, and it's not possible to switch an existing report from one approach to the other.
Treat SAP HANA as a multi-dimensional source (default)
All new connections to SAP HANA use this connection method by default, treating SAP HANA as a multi-dimensional source. In order to treat a connection to SAP HANA as a relational source, you must select File > Options and settings > Options, then check the box under Direct Query > Treat SAP HANA as a relational source.
When connecting to SAP HANA as a multi-dimensional source, the following considerations apply:
In the Get Data Navigator, a single SAP HANA view can be selected. It isn't possible to select individual measures or attributes. There's no query defined at the time of connecting, which is different from importing data or when using DirectQuery while treating SAP HANA as a relational source. This consideration also means that it's not possible to directly use an SAP HANA SQL query when selecting this connection method.
All the measures, hierarchies, and attributes of the selected view are displayed in the field list.
As a measure is used in a visual, SAP HANA is queried to retrieve the measure value at the level of aggregation necessary for the visual. When dealing with non-additive measures, such as counters and ratios, all aggregations are performed by SAP HANA, and no further aggregation is performed by Power BI.
To ensure the correct aggregate values can always be obtained from SAP HANA, certain restrictions must be imposed. For example, it's not possible to add calculated columns, or to combine data from multiple SAP HANA views within the same report.
Treating SAP HANA as a multi-dimensional source doesn't offer the greater flexibility provided by the alternative relational approach, but it's simpler. The approach also ensures correct aggregate values when dealing with more complex SAP HANA measures, and generally results in higher performance.
The Field list includes all measures, attributes, and hierarchies from the SAP HANA view. Note the following behaviors that apply when using this connection method:
Any attribute that is included in at least one hierarchy is hidden by default. However, they can be seen if required by selecting View hidden from the context menu on the field list. From the same context menu they can be made visible, if necessary.
In SAP HANA, an attribute can be defined to use another attribute as its label. For example, Product, with values
1,2,3, and so on, could use ProductName, with valuesBike,Shirt,Gloves, and so on, as its label. In this case, a single field Product is shown in the field list, whose values are the labelsBike,Shirt,Gloves, and so on, but which is sorted by, and with uniqueness determined by, the key values1,2,3. A hidden column Product.Key is also created, allowing access to the underlying key values if necessary.
Any variables defined in the underlying SAP HANA view are displayed at the time of connecting, and the necessary values can be entered. Those values can later be changed by selecting Transform data from the ribbon, and then Edit parameters from the dropdown menu displayed.
The modeling operations allowed are more restrictive than in the general case when using DirectQuery, given the need to ensure that correct aggregate data can always be obtained from SAP HANA. However, it's still possible to make many additions and changes, including defining measures, renaming and hiding fields, and defining display formats. All such changes are preserved on refresh, and any non-conflicting changes made to the SAP HANA view are applied.
Additional modeling restrictions
The other primary modeling restrictions when connecting to SAP HANA using DirectQuery (treat as multi-dimensional source) are the following restrictions:
- No support for calculated columns: The ability to create calculated columns is disabled. This fact also means that Grouping and Clustering, which create calculated columns, aren't available.
- Additional limitations for measures: There are other limitations imposed on the DAX expressions that can be used in measures, to reflect the level of support offered by SAP HANA.
- No support for defining relationships: Only a single view can be queried within a report, and as such, there's no support for defining relationships.
- No Data View: The Data View normally displays the detail level data in the tables. Given the nature of OLAP sources such as SAP HANA, this view isn't available over SAP HANA.
- Column and measure details are fixed: The list of columns and measures seen in the field list are fixed by the underlying source, and can't be modified. For example, it's not possible to delete a column, nor change its datatype. It can, however, be renamed.
- Additional limitations in DAX: There are other limitations on the DAX that can be used in measure definitions, to reflect limitations in the source. For example, it's not possible to use an aggregate function over a table.
Additional visualization restrictions
There are restrictions in visuals when connecting to SAP HANA using DirectQuery (treat as multi-dimensional source):
- No aggregation of columns: It's not possible to change the aggregation for a column on a visual, and it's always Do Not Summarize.
Treat SAP HANA as a relational source
When choosing to connect to SAP HANA as a relational source, some extra flexibility becomes available. For example, you can create calculated columns, include data from multiple SAP HANA views, and create relationships between the resulting tables. However, there are differences from the behavior when treating SAP HANA as a multidimensional source, particularly when the SAP HANA view contains non-additive measures, for example, distinct counts, or averages, rather than simple sums, and related to the efficiency of the queries that are run against SAP HANA.
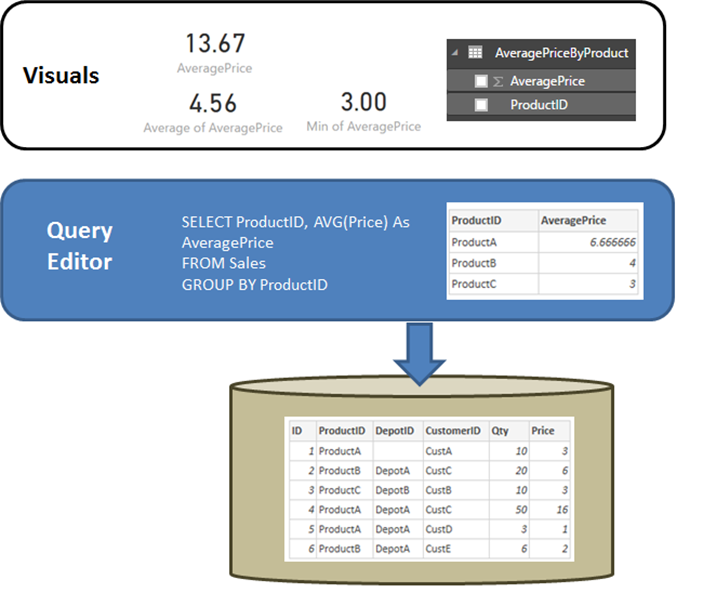
It's useful to start by clarifying the behavior of a relational source such as SQL Server, when the query defined in Get Data or Power Query Editor performs an aggregation. In the example that follows, a query defined in Power Query Editor returns the average price by ProductID.
If the data is being imported into Power BI versus using DirectQuery, the following situation would result:
- The data is imported at the level of aggregation defined by the query created in Power Query Editor. For example, average price by product. This fact results in a table with the two columns ProductID and AveragePrice that can be used in visuals.
- In a visual, any subsequent aggregation, such as Sum, Average, Min, and others, is performed over that imported data. For example, including AveragePrice on a visual uses the Sum aggregate by default, and would return the sum over the AveragePrice for each ProductID, in this example, 13.67. The same applies to any alternative aggregate function, such as Min or Average, used on the visual. For example, Average of AveragePrice returns the average of 6.66, 4 and 3, which equates to 4.56, and not the average of Price on the six records in the underlying table, which is 5.17.
If DirectQuery over that same relational source is being used instead of Import, the same semantics apply and the results would be exactly the same:
Given the same query, logically exactly the same data is presented to the reporting layer – even though the data isn't actually imported.
In a visual, any subsequent aggregation, such as Sum, Average, and Min, is again performed over that logical table from the query. And again, a visual containing Average of AveragePrice returns the same 4.56.
Consider SAP HANA when the connection is treated as a relational source. Power BI can work with both Analytic Views and Calculation Views in SAP HANA, both of which can contain measures. Yet today the approach for SAP HANA follows the same principles as described previously in this section: the query defined in Get Data or Power Query Editor determines the data available, and then any subsequent aggregation in a visual is over that data, and the same applies for both Import and DirectQuery. However, given the nature of SAP HANA, the query defined in the initial Get Data dialog or Power Query Editor is always an aggregate query, and generally includes measures where the actual aggregation that are used is defined by the SAP HANA view.
The equivalent of the previous SQL Server example is that there's an SAP HANA view containing ID, ProductID, DepotID, and measures including AveragePrice, defined in the view as Average of Price.
If in the Get Data experience, the selections made were for ProductID and the AveragePrice measure, then that is defining a query over the view, requesting that aggregate data. In the earlier example, for simplicity pseudo-SQL is used that doesn’t match the exact syntax of SAP HANA SQL. Then any further aggregations defined in a visual are further aggregating the results of such a query. Again, as described previously for SQL Server, this result applies both for the Import and DirectQuery case. In the DirectQuery case, the query from Get Data or Power Query Editor are used in a subselect within a single query sent to SAP HANA, and thus it isn't actually the case that all the data would be read in, prior to aggregating further.
All of these considerations and behaviors necessitate the following important considerations when using DirectQuery over SAP HANA:
Attention must be paid to any further aggregation performed in visuals, whenever the measure in SAP HANA is non-additive, for example, not a simple Sum, Min, or Max.
In Get Data or Power Query Editor, only the required columns should be included to retrieve the necessary data, reflecting the fact that the result is a query that must be a reasonable query that can be sent to SAP HANA. For example, if dozens of columns were selected, with the thought that they might be needed on subsequent visuals, then even for DirectQuery a simple visual means the aggregate query used in the subselect contains those dozens of columns, which generally perform poorly.
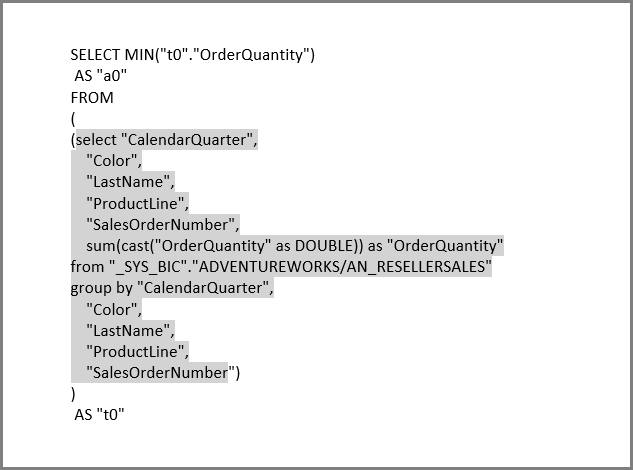
In the following example, selecting five columns (CalendarQuarter, Color, LastName, ProductLine, SalesOrderNumber) in the Get Data dialog, along with the measure OrderQuantity, means that later creating a simple visual containing the Min OrderQuantity results in the following SQL query to SAP HANA. The shaded is the subselect, containing the query from Get Data / Power Query Editor. If this subselect gives a high cardinality result, then the resulting SAP HANA performance is likely to be poor.
Because of this behavior, we recommend the items selected in Get Data or Power Query Editor be limited to those items that are needed, while still resulting in a reasonable query for SAP HANA.
Best practices
For both approaches to connecting to SAP HANA, recommendations for using DirectQuery also apply to SAP HANA, particularly recommendations related to ensuring good performance. For more information, see using DirectQuery in Power BI.
Considerations and limitations
The following list describes all SAP HANA features that aren't fully supported, or features that behave differently when using Power BI.
- Parent Child Hierarchies: Parent child hierarchies aren't visible in Power BI. This fact is because Power BI accesses SAP HANA using the SQL interface, and parent child hierarchies can't be fully accessed by using SQL.
- Other hierarchy metadata: The basic structure of hierarchies is displayed in Power BI, however some hierarchy metadata, such as controlling the behavior of ragged hierarchies, have no effect. Again, this fact is due to the limitations imposed by the SQL interface.
- Connection using SSL: You can connect using Import and multi-dimensional with TLS, but can't connect to SAP HANA instances configured to use TLS for the relational connector.
- Support for Attribute views: Power BI can connect to Analytic and Calculation views, but can't connect directly to Attribute views.
- Support for Catalog objects: Power BI can't connect to Catalog objects.
- Change to Variables after publish: You can't change the values for any SAP HANA variables directly in the Power BI service, after the report is published.
Known issues
The following list describes all known issues when connecting to SAP HANA (DirectQuery) using Power BI.
SAP HANA issue when query for Counters, and other measures: Incorrect data is returned from SAP HANA if connecting to an Analytical View, and a Counter measure and some other ratio measure, are included in the same visual. This issue is covered by SAP Note 2128928 (Unexpected results when query a Calculated Column and a Counter). The ratio measure is incorrect in this case.
Multiple Power BI columns from single SAP HANA column: For some calculation views, where an SAP HANA column is used in more than one hierarchy, SAP HANA exposes the column as two separate attributes. This approach results in two columns being created in Power BI. Those columns are hidden by default, however, and all queries involving the hierarchies, or the columns directly, behave correctly.
Related content
For more information about DirectQuery, check out the following resources:
Feedback
Coming soon: Throughout 2024 we will be phasing out GitHub Issues as the feedback mechanism for content and replacing it with a new feedback system. For more information see: https://aka.ms/ContentUserFeedback.
Submit and view feedback for