Events
Power BI DataViz World Championships
14 Feb, 4 pm - 31 Mar, 4 pm
With 4 chances to enter, you could win a conference package and make it to the LIVE Grand Finale in Las Vegas
Learn moreThis browser is no longer supported.
Upgrade to Microsoft Edge to take advantage of the latest features, security updates, and technical support.
Using a sample semantic model to work through the steps below, this tutorial shows you how to implement row-level security in an on-premises Analysis Services Tabular Model and use it in a Power BI report.
This tutorial requires the AdventureworksDW2012 database.
You can find many articles describing how to define row-level dynamic security with the SQL Server Analysis Services (SSAS) tabular model.
The steps here require using the AdventureworksDW2012 relational database.
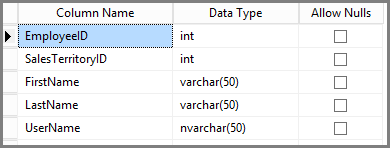
In AdventureworksDW2012, create the DimUserSecurity table as shown below. You can use SQL Server Management Studio (SSMS) to create the table.
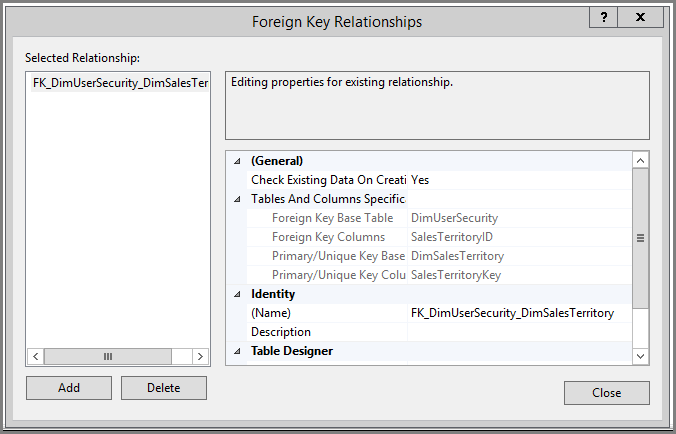
Once you create and save the table, you need to establish the relationship between the DimUserSecurity table's SalesTerritoryID column and the DimSalesTerritory table's SalesTerritoryKey column, as shown below.
In SSMS, right-click DimUserSecurity, and select Design. Then select Table Designer > Relationships.... When done, save the table.
Add users to the table. Right-click DimUserSecurity and select Edit Top 200 Rows. Once you've added users, the DimUserSecurity table should appear similar to the following example:
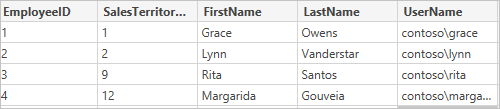
You'll see these users in upcoming tasks.
Next, do an inner join with the DimSalesTerritory table, which shows the user associated region details. The SQL code here does the inner join, and the image shows how the table then appears.
select b.SalesTerritoryCountry, b.SalesTerritoryRegion, a.EmployeeID, a.FirstName, a.LastName, a.UserName from [dbo].[DimUserSecurity] as a join [dbo].[DimSalesTerritory] as b on a.[SalesTerritoryID] = b.[SalesTerritoryKey]
The joined table shows who is responsible for each sales region, thanks to the relationship created in Step 2. For example, you can see that Rita Santos is responsible for Australia.
Once your relational data warehouse is in place, you need to define the tabular model. You can create the model using SQL Server Data Tools (SSDT). For more information, see Create a New Tabular Model Project.
Import all the necessary tables into the model as shown below.

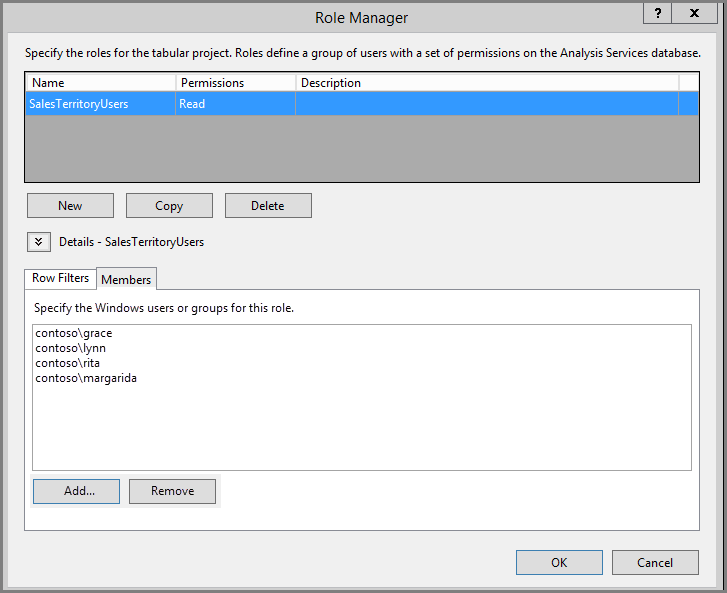
Once you've imported the necessary tables, you need to define a role called SalesTerritoryUsers with Read permission. Select the Model menu in SQL Server Data Tools, and then select Roles. In Role Manager, select New.
Under Members in the Role Manager, add the users that you defined in the DimUserSecurity table in Task 1.
Next, add the proper functions for both DimSalesTerritory and DimUserSecurity tables, as shown below under Row Filters tab.
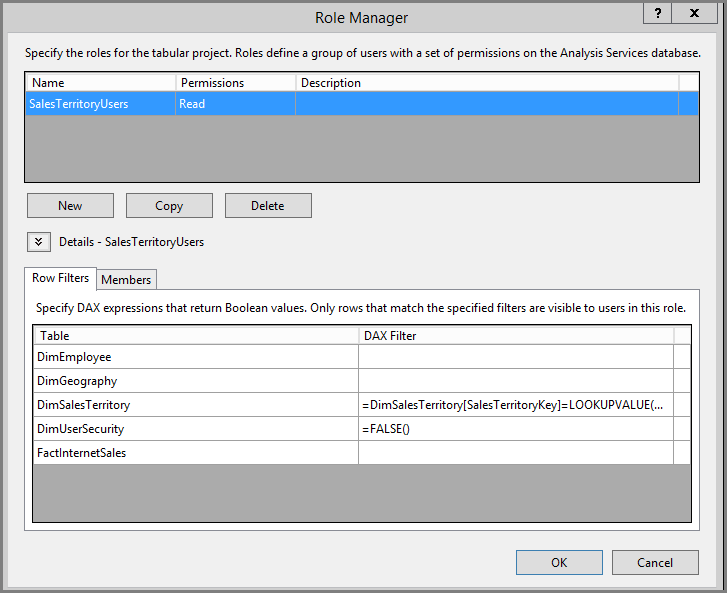
The LOOKUPVALUE function returns values for a column in which the Windows user name matches the one the USERNAME function returns. You can then restrict queries to where the LOOKUPVALUE returned values match ones in the same or related table. In the DAX Filter column, type the following formula:
=DimSalesTerritory[SalesTerritoryKey]=LOOKUPVALUE(DimUserSecurity[SalesTerritoryID], DimUserSecurity[UserName], USERNAME(), DimUserSecurity[SalesTerritoryID], DimSalesTerritory[SalesTerritoryKey])
In this formula, the LOOKUPVALUE function returns all values for the DimUserSecurity[SalesTerritoryID] column, where the DimUserSecurity[UserName] is the same as the current logged on Windows user name, and DimUserSecurity[SalesTerritoryID] is the same as the DimSalesTerritory[SalesTerritoryKey].
Important
When using row-level security, the DAX function USERELATIONSHIP is not supported.
The set of Sales SalesTerritoryKey's LOOKUPVALUE returns is then used to restrict the rows shown in the DimSalesTerritory. Only rows where the SalesTerritoryKey value is in the IDs that the LOOKUPVALUE function returns are displayed.
For the DimUserSecurity table, in the DAX Filter column, add the following formula:
=FALSE()
This formula specifies that all columns resolve to false; meaning DimUserSecurity table columns can't be queried.
Now you need to process and deploy the model. For more information, see Deploy.
Once your tabular model is deployed and ready for consumption, you need to add a data source connection to your on-premises Analysis Services tabular server.
To allow the Power BI service access to your on-premises analysis service, you need an on-premises data gateway installed and configured in your environment.
Once the gateway is correctly configured, you need to create a data source connection for your Analysis Services tabular instance. For more information, see Manage your data source - Analysis Services.
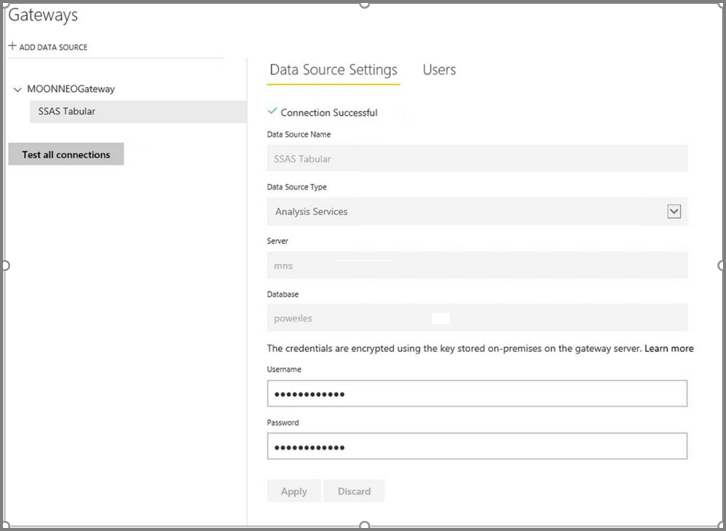
With this procedure complete, the gateway is configured and ready to interact with your on-premises Analysis Services data source.
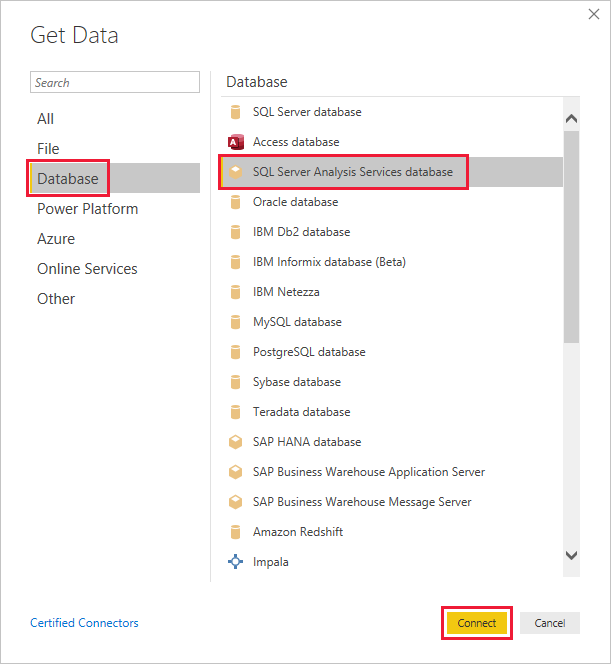
Start Power BI Desktop and select Get data > Database.
From the data sources list, select the SQL Server Analysis Services Database and select Connect.
Fill in your Analysis Services tabular instance details and select Connect live. Then select OK.
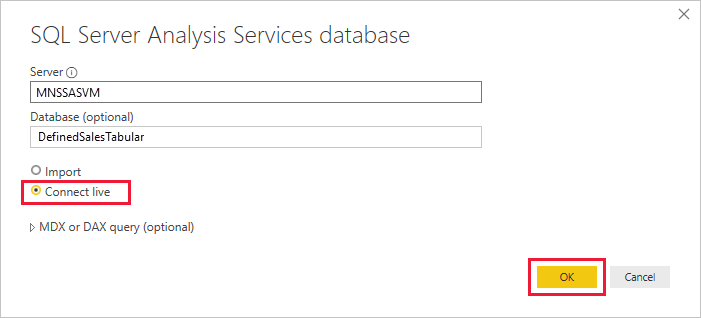
With Power BI, dynamic security works only with a live connection.
You can see that the deployed model is in the Analysis Services instance. Select the respective model and then select OK.
Power BI Desktop now displays all the available fields, to the right of the canvas in the Fields pane.
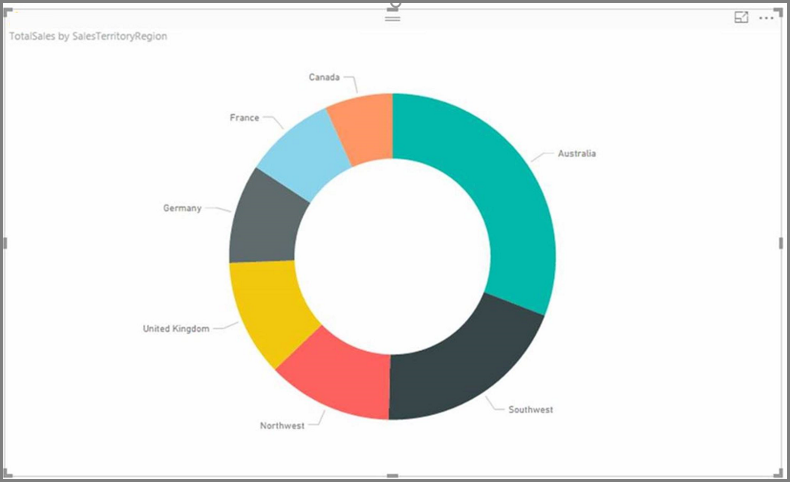
In the Fields pane, select the SalesAmount measure from the FactInternetSales table and the SalesTerritoryRegion dimension from the SalesTerritory table.
To keep this report simple, we won't add any more columns right now. To have a more meaningful data representation, change the visualization to Donut chart.
Once your report is ready, you can directly publish it to the Power BI portal. From the Home ribbon in Power BI Desktop, select Publish.
You've created the report and published it to the Power BI service. Now you can use the example created in previous steps to demonstrate the model security scenario.
In the role as Sales Manager, the user Grace can see data from all the different sales regions. Grace creates this report and publishes it to the Power BI service. This report was created in the previous tasks.
Once Grace publishes the report, the next step is to create a dashboard in the Power BI service called TabularDynamicSec based on that report. In the following image, notice that Grace can see the data corresponding to all the sales region.
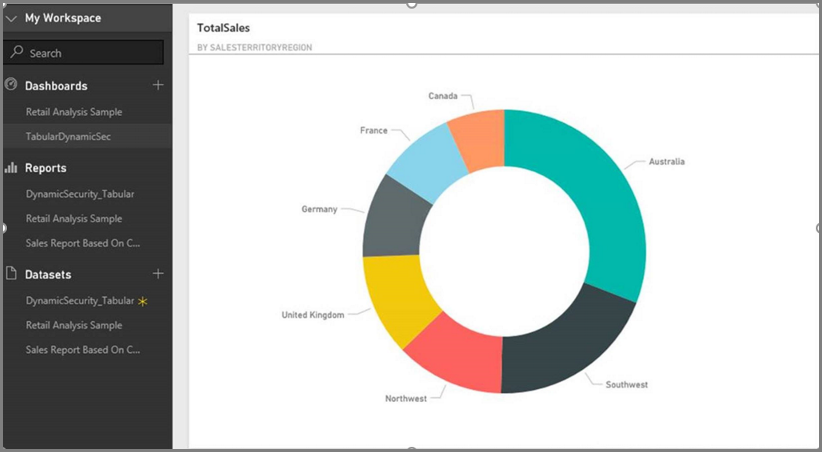
Now Grace shares the dashboard with a colleague, Rita, who is responsible for the Australia region sales.
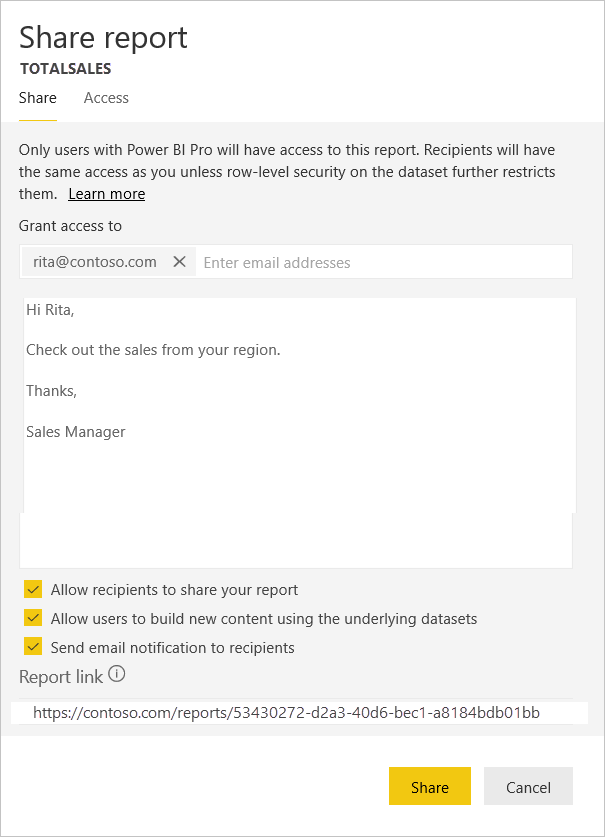
When Rita logs in to the Power BI service and views the shared dashboard that Grace created, only sales from the Australia region are visible.
Congratulations! The Power BI service shows the dynamic row-level security defined in the on-premises Analysis Services tabular model. Power BI uses the EffectiveUserName property to send the current Power BI user credential to the on-premises data source to run the queries.
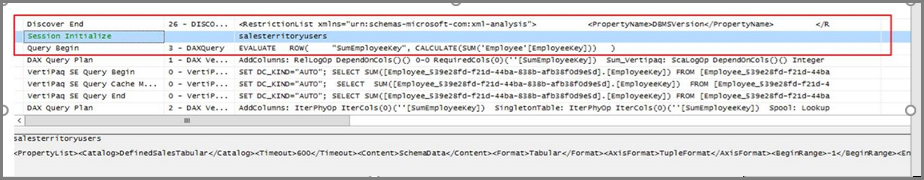
This task assumes you're familiar with SQL Server Profiler, since you need to capture a SQL Server profiler trace on your on-premises SSAS tabular instance.
The session gets initialized as soon as the user, Rita, accesses the dashboard in the Power BI service. You can see that the salesterritoryusers role takes an immediate effect with the effective user name as <EffectiveUserName>rita@contoso.com</EffectiveUserName>
<PropertyList><Catalog>DefinedSalesTabular</Catalog><Timeout>600</Timeout><Content>SchemaData</Content><Format>Tabular</Format><AxisFormat>TupleFormat</AxisFormat><BeginRange>-1</BeginRange><EndRange>-1</EndRange><ShowHiddenCubes>false</ShowHiddenCubes><VisualMode>0</VisualMode><DbpropMsmdFlattened2>true</DbpropMsmdFlattened2><SspropInitAppName>PowerBI</SspropInitAppName><SecuredCellValue>0</SecuredCellValue><ImpactAnalysis>false</ImpactAnalysis><SQLQueryMode>Calculated</SQLQueryMode><ClientProcessID>6408</ClientProcessID><Cube>Model</Cube><ReturnCellProperties>true</ReturnCellProperties><CommitTimeout>0</CommitTimeout><ForceCommitTimeout>0</ForceCommitTimeout><ExecutionMode>Execute</ExecutionMode><RealTimeOlap>false</RealTimeOlap><MdxMissingMemberMode>Default</MdxMissingMemberMode><DisablePrefetchFacts>false</DisablePrefetchFacts><UpdateIsolationLevel>2</UpdateIsolationLevel><DbpropMsmdOptimizeResponse>0</DbpropMsmdOptimizeResponse><ResponseEncoding>Default</ResponseEncoding><DirectQueryMode>Default</DirectQueryMode><DbpropMsmdActivityID>4ea2a372-dd2f-4edd-a8ca-1b909b4165b5</DbpropMsmdActivityID><DbpropMsmdRequestID>2313cf77-b881-015d-e6da-eda9846d42db</DbpropMsmdRequestID><LocaleIdentifier>1033</LocaleIdentifier><EffectiveUserName>rita@contoso.com</EffectiveUserName></PropertyList>
Based on the effective user name request, Analysis Services converts the request to the actual contoso\rita credential after querying the local Active Directory. Once Analysis Services gets the credential, Analysis Services returns the data the user has permission to view and access.
If more activity occurs with the dashboard, with SQL Profiler you would see a specific query coming back to the Analysis Services tabular model as a DAX query. For example, if Rita goes from the dashboard to the underlying report, the following query occurs.
You can also see below the DAX query that is getting executed to populate report data.
EVALUATE
  ROW(
    "SumEmployeeKey", CALCULATE(SUM(Employee[EmployeeKey]))
  )

<PropertyList xmlns="urn:schemas-microsoft-com:xml-analysis">``
          <Catalog>DefinedSalesTabular</Catalog>
          <Cube>Model</Cube>
          <SspropInitAppName>PowerBI</SspropInitAppName>
          <EffectiveUserName>rita@contoso.com</EffectiveUserName>
          <LocaleIdentifier>1033</LocaleIdentifier>
          <ClientProcessID>6408</ClientProcessID>
          <Format>Tabular</Format>
          <Content>SchemaData</Content>
          <Timeout>600</Timeout>
          <DbpropMsmdRequestID>8510d758-f07b-a025-8fb3-a0540189ff79</DbpropMsmdRequestID>
          <DbPropMsmdActivityID>f2dbe8a3-ef51-4d70-a879-5f02a502b2c3</DbPropMsmdActivityID>
          <ReturnCellProperties>true</ReturnCellProperties>
          <DbpropMsmdFlattened2>true</DbpropMsmdFlattened2>
          <DbpropMsmdActivityID>f2dbe8a3-ef51-4d70-a879-5f02a502b2c3</DbpropMsmdActivityID>
        </PropertyList>
On-premises row-level security with Power BI is only available with live connection.
Any changes in the data after processing the model would be immediately available for the users accessing the report with live connection from the Power BI service.
Events
Power BI DataViz World Championships
14 Feb, 4 pm - 31 Mar, 4 pm
With 4 chances to enter, you could win a conference package and make it to the LIVE Grand Finale in Las Vegas
Learn moreTraining
Module
Implement row-level security - Training
Row-level security (RLS) allows you to create a single or a set of reports that targets data for a specific user. In this module, you'll learn how to implement RLS by using either a static or dynamic method and how Microsoft Power BI simplifies testing RLS in Power BI Desktop and Power BI service.
Certification
Microsoft Certified: Power BI Data Analyst Associate - Certifications
Demonstrate methods and best practices that align with business and technical requirements for modeling, visualizing, and analyzing data with Microsoft Power BI.
Documentation
Connect to Analysis Services data in Power BI Desktop - Power BI
Learn how to connect to and get data from SQL Server Analysis Services tabular models by using a live connection or by importing items into Power BI Desktop.
Analysis Services multidimensional data in Power BI Desktop - Power BI
Learn how to access SQL Server Analysis Services multidimensional data in Power BI Desktop. You can publish models in live mode to the Power BI service.
Configure Analysis Services tabular model roles
Learn how to configure roles in tabular models so you can define member permissions for a model.