Identify and use buttons in the Power BI service
In the reports you receive from colleagues, you might have noticed buttons and wondered how to use them. Some buttons have words, some have arrows, others have graphics, and some even have dropdown menus. This article shows you how to recognize and use buttons.
For information on how to add buttons to reports, see Create buttons in Power BI reports.
How to recognize a button
A button can resemble a shape, image, or icon from a report page, but if an action occurs when you select it, then it's probably a button.
Types of buttons
Report creators add buttons on reports to help you with navigation and exploration. Here are some button types: back, bookmark, arrow, Q&A, help, and blank.
Back buttons
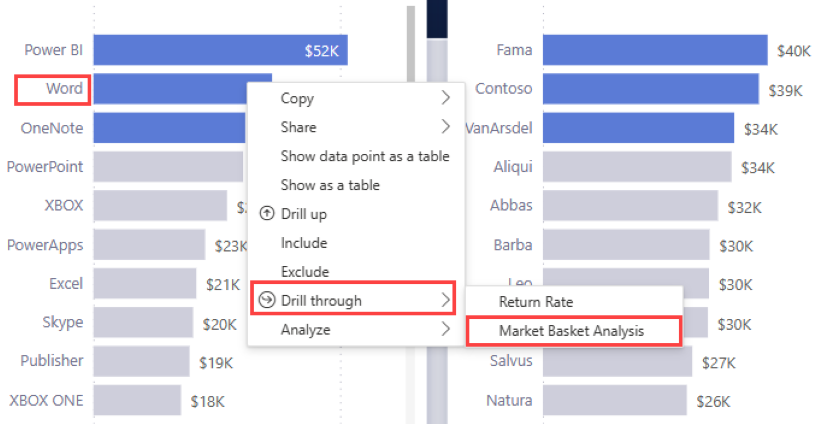
A back button can have an arrow icon. When you select it, Power BI takes you to the previous page. Back buttons are often used with drillthrough. Here's an example of the steps of a back button used with drillthrough.
Select Word in the bar chart and drill through to Market basket analysis.
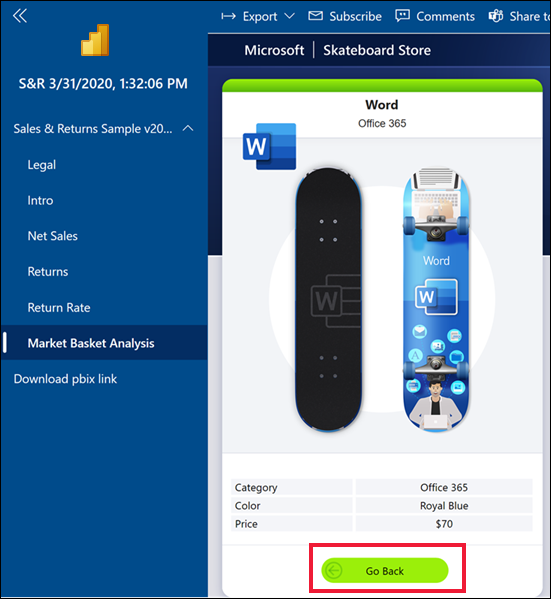
Power BI opens the Market basket analysis report page and uses the selections made on the source page to filter what displays on the destination page. In this example, the Market basket analysis report page is filtered for Word.
Select the back button labeled Go back to return to the previous page.
Bookmark buttons
Report designers often include bookmarks with their reports. You can view the list of report bookmarks by selecting Bookmarks from the upper right corner. When a report designer adds a bookmark button, it's just an alternate way to navigate to a particular report page associated with that bookmark. The page has the applied filters and settings captured by the bookmark. For more information, see Bookmarks in the Power BI service.
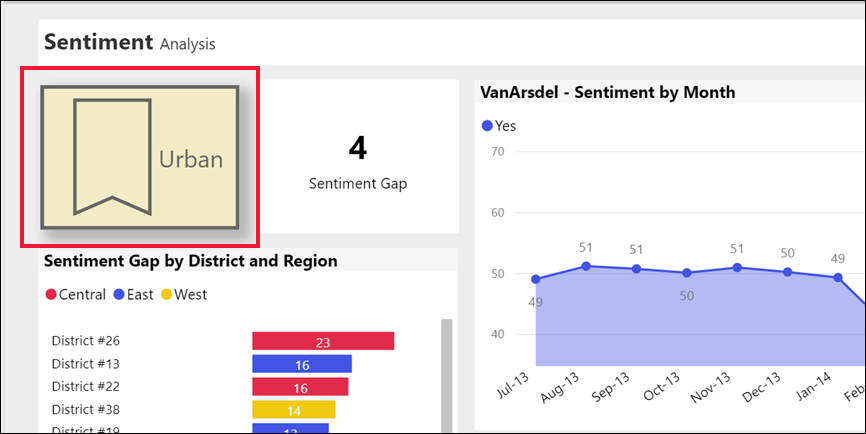
In the following example, the button has a bookmark icon and the bookmark name Urban.
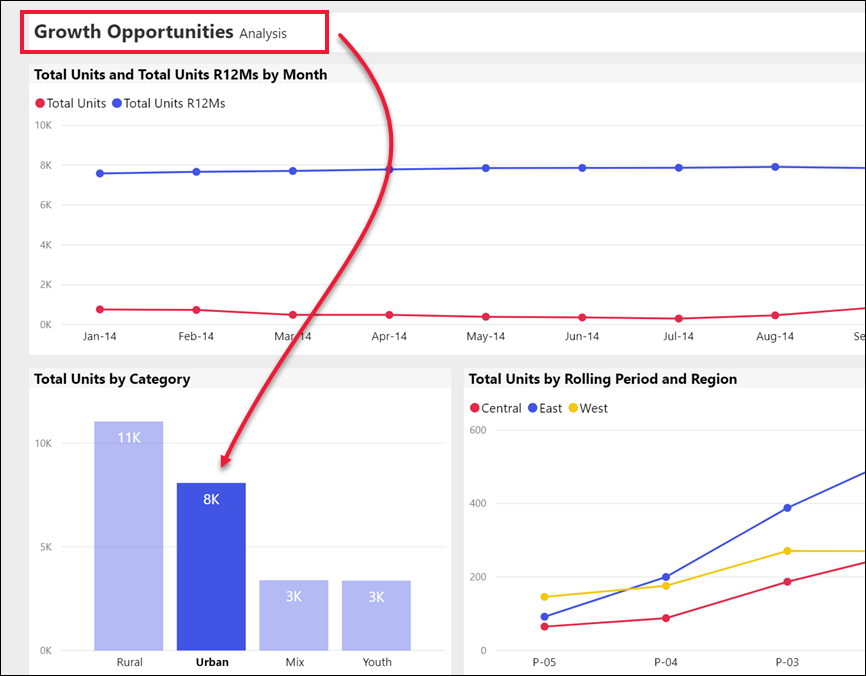
When selected, the bookmark button takes you to the location and settings defined for that bookmark. In this example, the bookmark is on the Growth opportunities report page that's cross-filtered for Urban.
Drillthrough buttons
There are two ways to drill through in the Power BI service. Drilling through takes you to a different report page. The data on that destination page displays according to the filters and selections you've made on the source page.
One way to drill through in a report is to right-click a data point in a visual, select Drill through, and choose the destination. For more information on this method, see Back buttons. The second method report designers use is to add a drillthrough button. The button makes the action more obvious and calls attention to important insights.
Drillthrough buttons can have more than one prerequisite. If you don't fulfill all the prerequisites, the button won't work. Let's look at an example.
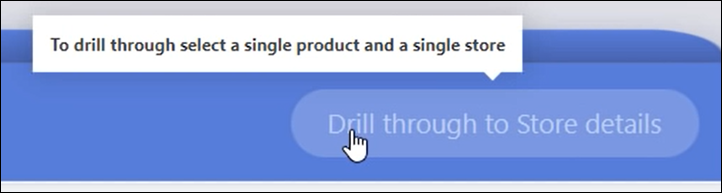
Here the drillthrough button is designed to take you to the Store details page. Hovering over the button reveals a tooltip with the prerequisites. You need to select both a store and a product. Until you select one of each, the button remains inactive.
After you select one product (Word) and one store (Leo), the button changes color, signifying it's now active.
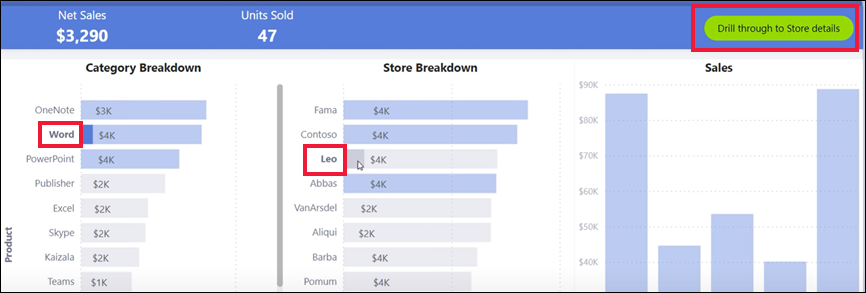
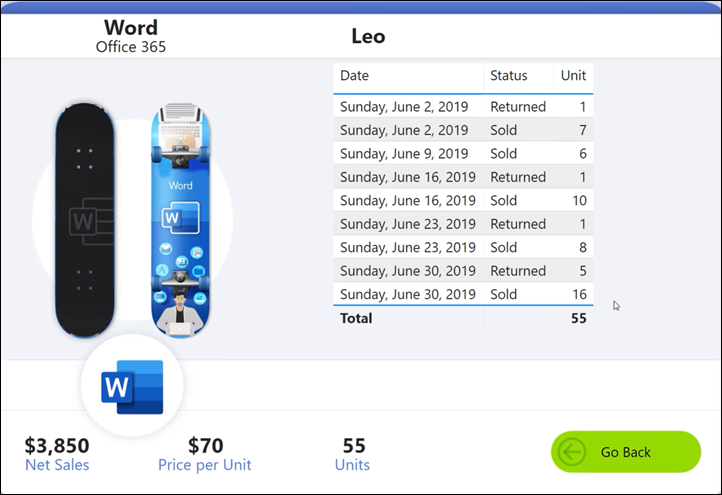
Selecting the drillthrough button takes you to the Store report page. The Store page displays according to your filters of Word and Leo.
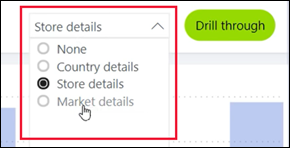
Drillthrough buttons can also have dropdown menus that offer a choice of destinations. After you've made your selections on the source report page, select the destination report page for the drillthrough. The following example shows the selection change to drill through to the Market details report page.
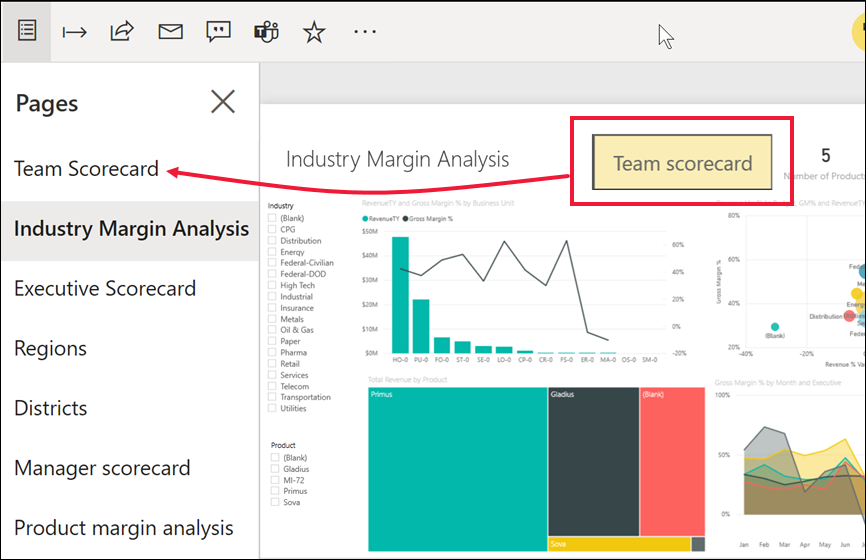
Page navigation
Page navigation buttons take you to a different page in the same report. Report designers often create navigation buttons to tell a story or guide you through the report insights. In the following example, the report designer added a button on each report page. The button takes you back to the first page (the top-level summary page) of the report. The page navigation button is helpful when there are multiple pages in a report.
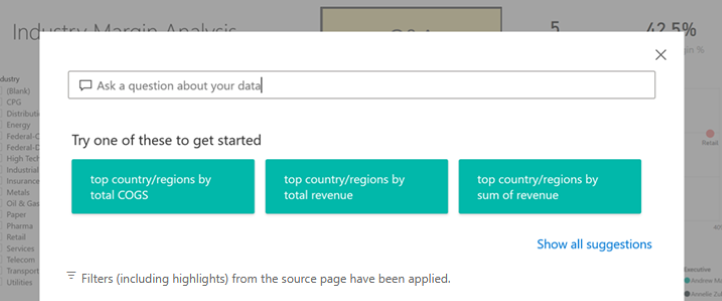
Q&A buttons
If you select a Q&A button it opens the Power BI Q&A Explorer window. The Q&A window displays on top of the report page and closes when you select the X. For more information, see Q&A for Power BI business users.
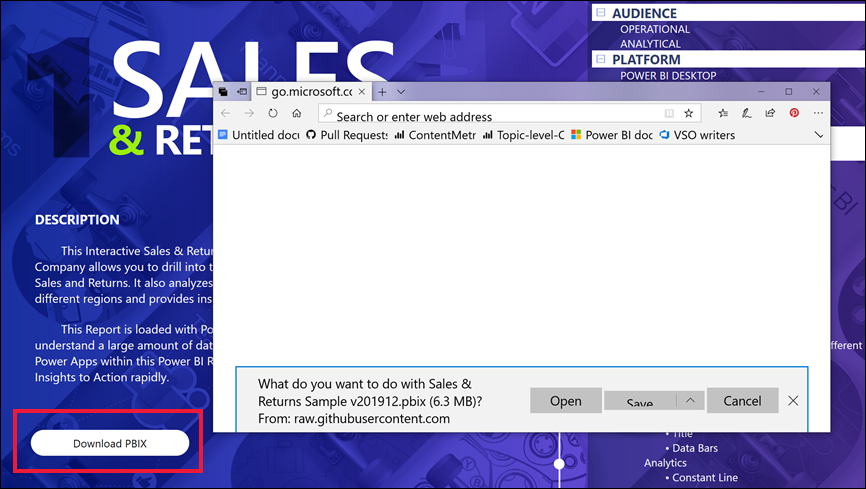
Web URL
Web URL buttons open a new browser window. Report designers might add this type of button as a reference source, to link to the corporate website or a help page, or even as a link to a different report or dashboard. In the following example, the Web URL button lets you download the source file for the report.
Since the page opens in a separate window, close the window, or select your Power BI tab to return to the Power BI report.
Related content
Feedback
Coming soon: Throughout 2024 we will be phasing out GitHub Issues as the feedback mechanism for content and replacing it with a new feedback system. For more information see: https://aka.ms/ContentUserFeedback.
Submit and view feedback for