Create connected metrics in Power BI
APPLIES TO: ![]() Power BI Desktop
Power BI Desktop ![]() Power BI service
Power BI service
Metrics in Power BI let customers curate their metrics and track them against key business objectives. When choosing values for your metrics, you have a choice of:
- Manually entering the current and target values.
- Connecting either the current or target value to data in an existing Power BI report.
- Connecting both values to data in an existing Power BI report.
This article is about connecting the values to data in an existing Power BI report. Connected values change whenever the underlying data is updated. To learn about creating manual values, see Create a manual metric in the article Create scorecards and manual metrics.
Connect values to data
You can connect either the current or the target value, or both, to a value in a report.
Create a metric or edit an existing metric in a scorecard.
In the Current or Target field, select Connect to data.
In the dialog, search for the report with the data that you want to track, select it > Next.
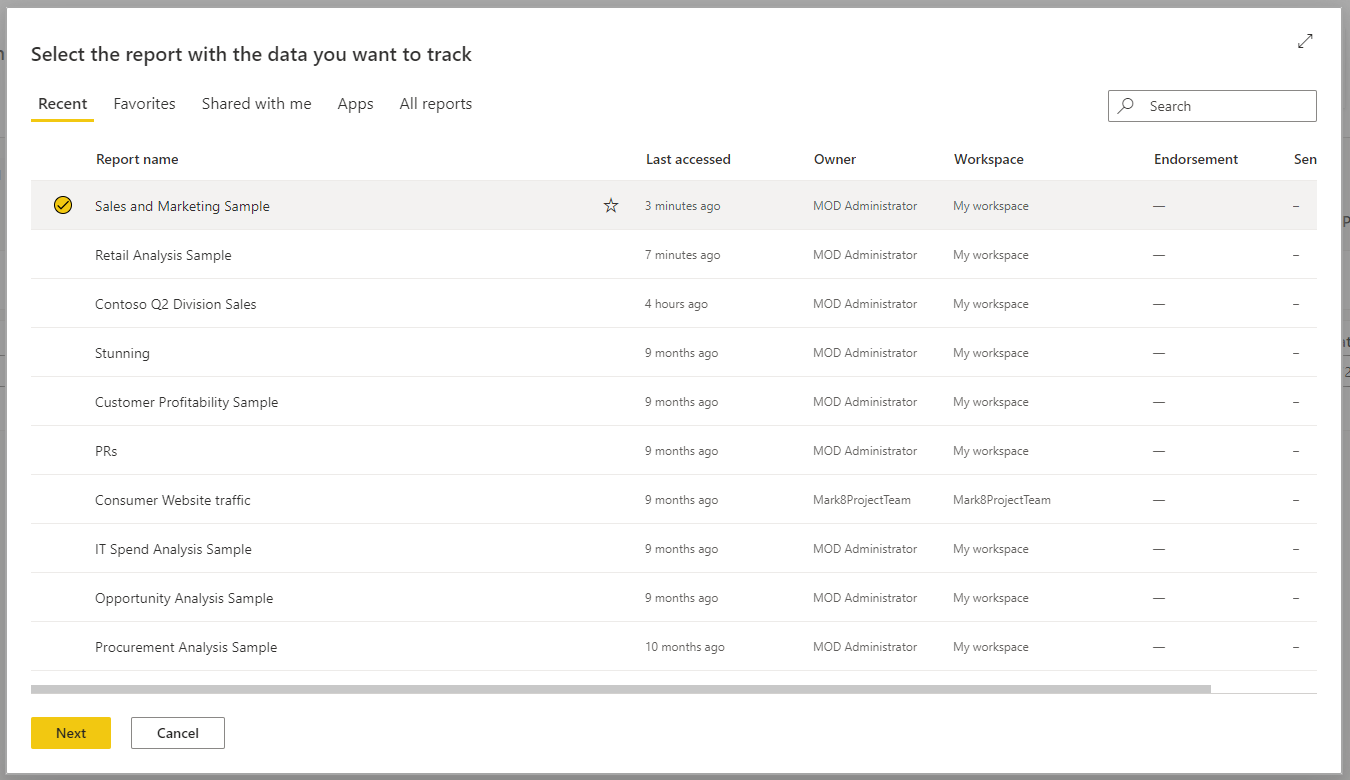
This list contains all the reports that you have access to, across all workspaces, in Power BI.
In the report that you selected, navigate to the visual that contains the data you want to track.
Select the data point or visual. Power BI displays the measure card, summarizing all the filters applied to the selection.
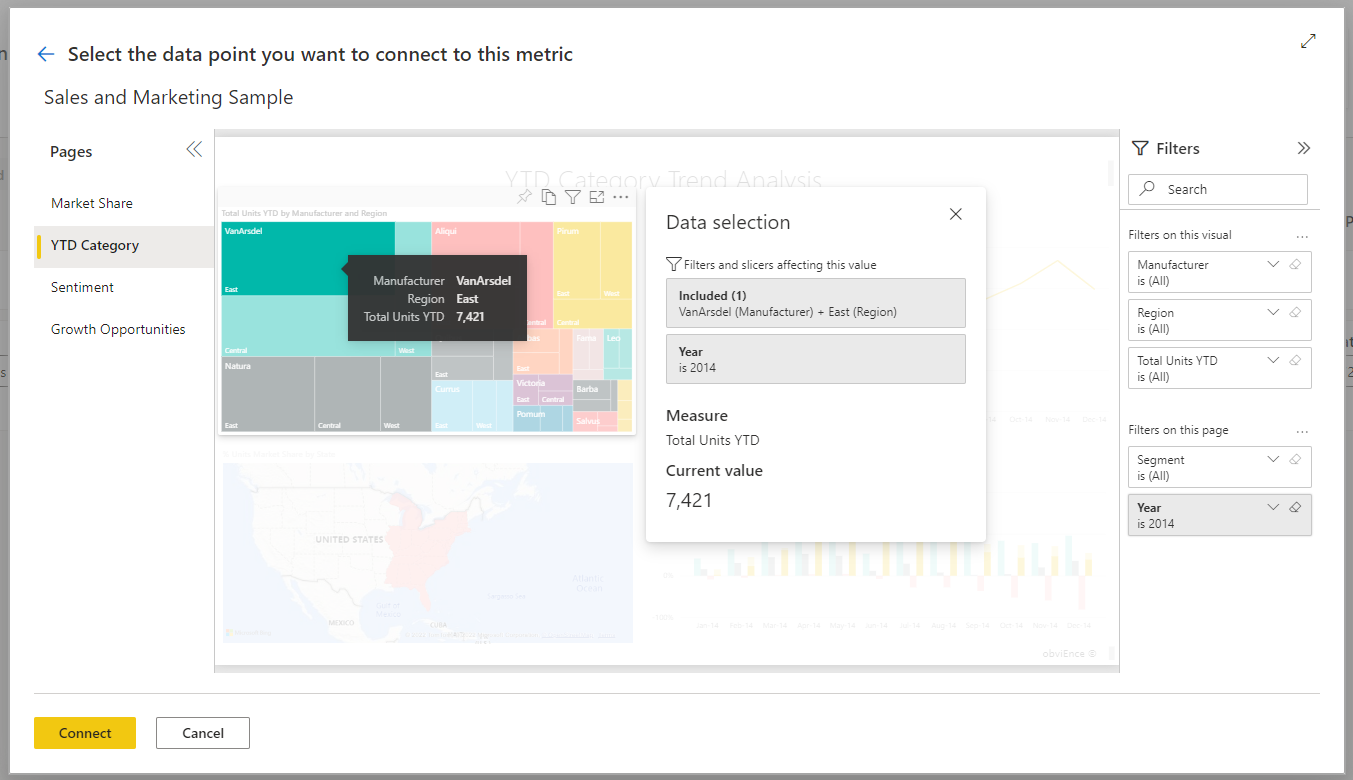
Currently there are some limitations on the values you can select. See the Considerations and limitations section in this article for details.
Select Connect.
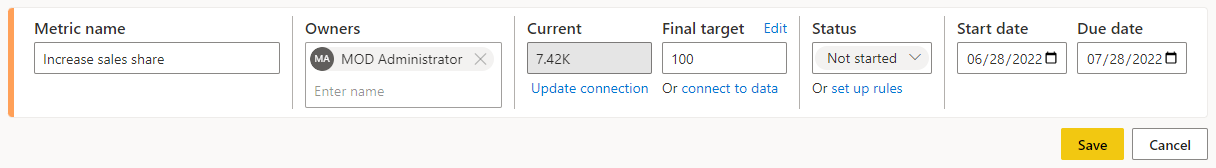
Power BI automatically represents values in numeric notation. For example, 2044 is represented as 2 K.
Select Save.
Choose measures for connected metrics
The Connect to data experience makes it easy for scorecard authors to automate metrics. You can select and calculate measures at the following levels:
- Visual
- Legend
- Data point
- Axis value
To break this down further, there are two main types of cases for connecting to data in metrics and submetrics:
- Categorical data
- Time-series data
Categorical data
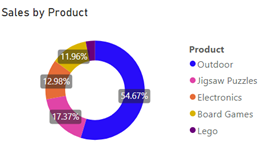
Categorical data refers to cases where you are connecting a metric or submetric to data other than time-series data. For example, connecting to the total sales of the Outdoor product category:
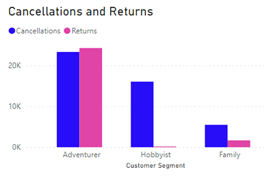
Or connecting to the total number of results in the Family customer segment:
In these cases, depending on what you select, Power BI calculates the measures as follows:
- Visual – measure is calculated at the aggregate level.
- Legend – measure is filtered to the selected legend.
- Data point – measure is filtered to the selected data point.
- Axis value – measure is filtered to the category selected in the axis.
Time-series data
The time series refers to cases where you have a Date/Time field in the axis. In these cases, Power BI calculates the measures as follows:
- Visual – measure is calculated at the last data point in time series and history is pulled in.
- Legend – measure is calculated at the last data point in time series and history is pulled in.
- Data point – measure is calculated at the last data point in time series and history is pulled in.
- Axis value – measure is calculated at the last data point in time series and history is pulled in.
Considerations and limitations
Currently there are limitations on the values you can choose in a visual.
- In a 100% stacked bar or column chart, Power BI will pull in the measure value rather than the percentage.
- In a multi-row card, Power BI will pull in the first measure in the card.
- Multi-Geo is currently not supported.
- In gauges and KPI tiles, Power BI will pull in the value, but not the target, or the min or max value in the gauge.
- In a table with more than one column of measures, Power BI selects the first measure in the row.
Related content
- Get started with metrics in Power BI
- Create scorecards and manual metrics in Power BI
- Stay on top of your metrics in Power BI
More questions? Try the Power BI Community.
Feedback
Coming soon: Throughout 2024 we will be phasing out GitHub Issues as the feedback mechanism for content and replacing it with a new feedback system. For more information see: https://aka.ms/ContentUserFeedback.
Submit and view feedback for