Generate data insights on your semantic model automatically with Power BI
APPLIES TO: ![]() Power BI Desktop
Power BI Desktop ![]() Power BI service
Power BI service
Do you have a new semantic model and aren't sure where to start? Need to build a dashboard quickly? Want to look for insights you might have missed?
Run quick insights to generate interesting visualizations based on your data. This article explains how to run quick insights on an entire semantic model (quick insights). You can also run quick insights on a specific dashboard tile (scoped insights). You can even run insights on an insight!
Note
The insights feature doesn't work with DirectQuery, streaming, and PUSH datasets; it only works with data uploaded to Power BI.
Row-level security (RLS) isn't supported by quick insights, even in import mode.
We built the insights feature on a growing set of advanced analytical algorithms that we developed with Microsoft Research. We continue to use these algorithms to help more people to find insights in their data in new and intuitive ways. You might also be interested in learning how to optimize your data for quick insights.
Run quick insights on a semantic model
Watch Amanda run quick insights on a semantic model and open an insight in Focus mode. Amanda pins an insight as a tile on the dashboard, then gets insights for a dashboard tile.
Note
This video might use earlier versions of Power BI Desktop or the Power BI service.
Now it's your turn. Explore insights by using the Supplier Quality Analysis sample.
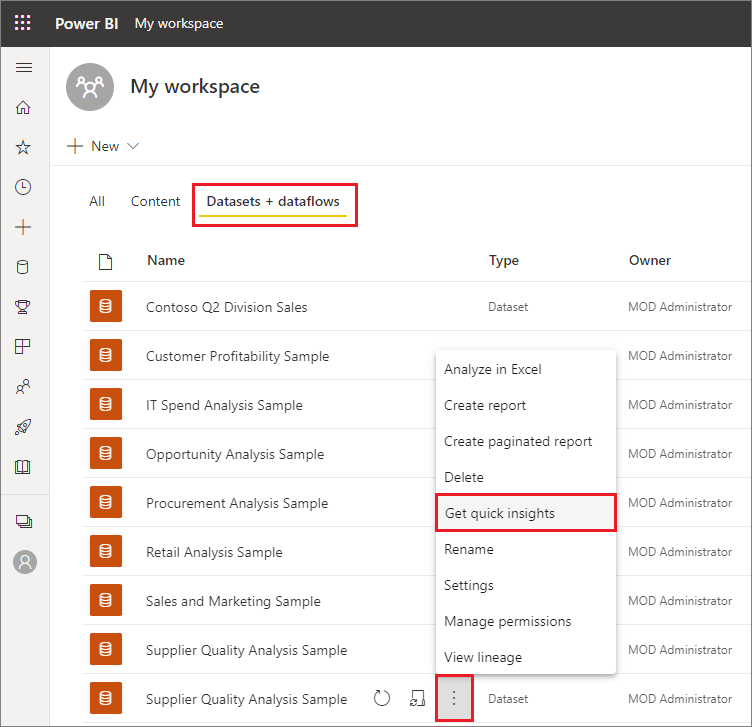
Choose the workspace where the semantic model is located. From the Semantic models + dataflows tab, select More options (...) next to the semantic model, and then choose Get quick insights.
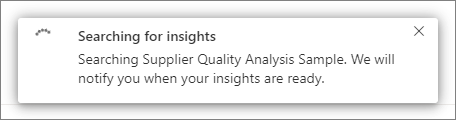
Power BI uses various algorithms to search for trends in your semantic model.
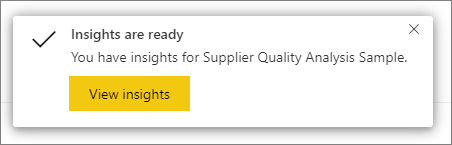
Within seconds, your insights are ready. Select View insights to display visualizations.
Note
Some semantic models can't generate insights because the data isn't statistically significant. For more information, see Optimize your data for Power BI quick insights.
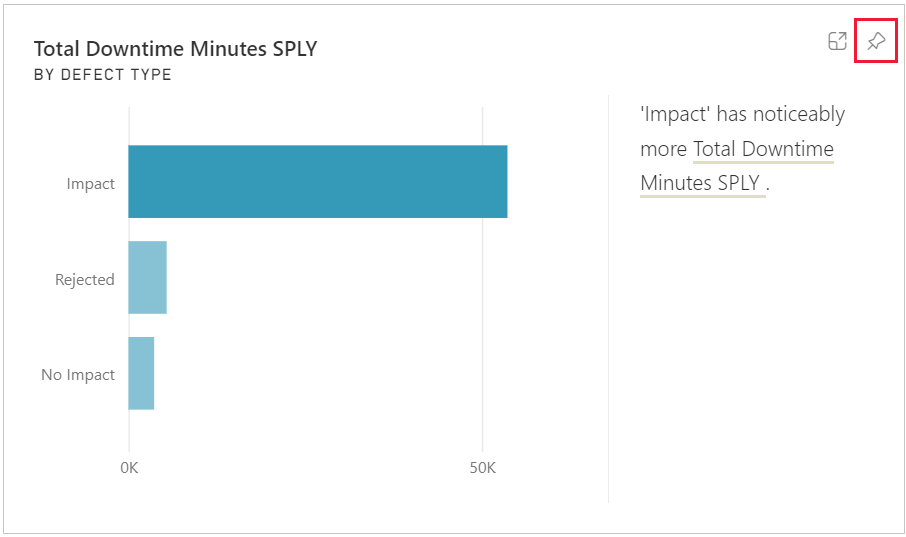
The visualizations display in a special Quick Insights canvas with up to 32 separate insight cards. Each card has a chart or graph plus a short description.


Interact with the insight cards
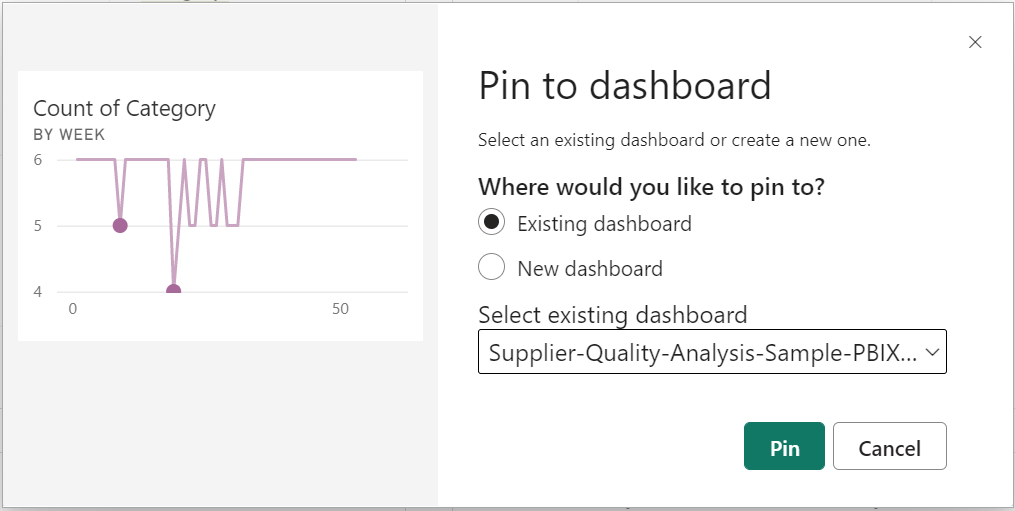
Hover over a card and select the pin icon to add the visualization to a dashboard.
- Pin the visualization to the dashboard of your choice.
- Pin the visualization to the dashboard of your choice.
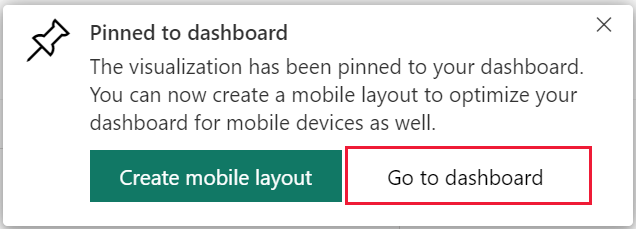
Go to the dashboard where you added the visualization.
Hover over the pinned card, select More options (...), and then choose View insights.
The insight screen opens in Focus mode.
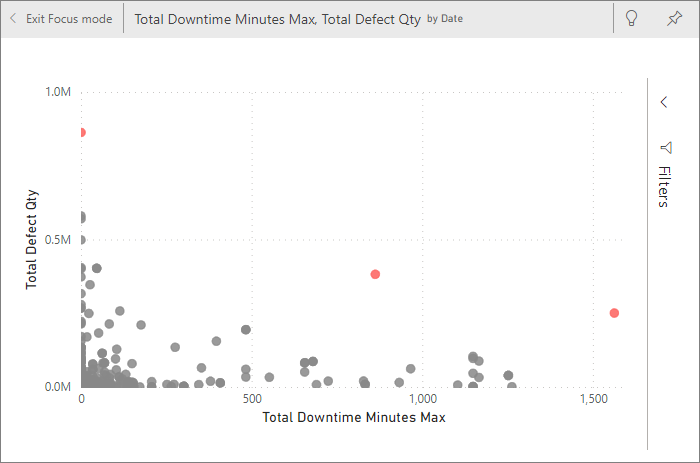
In Focus mode you can:
Filter the visualizations. If the Filters pane isn't already open, expand it by selecting the arrow on the right side of the window.
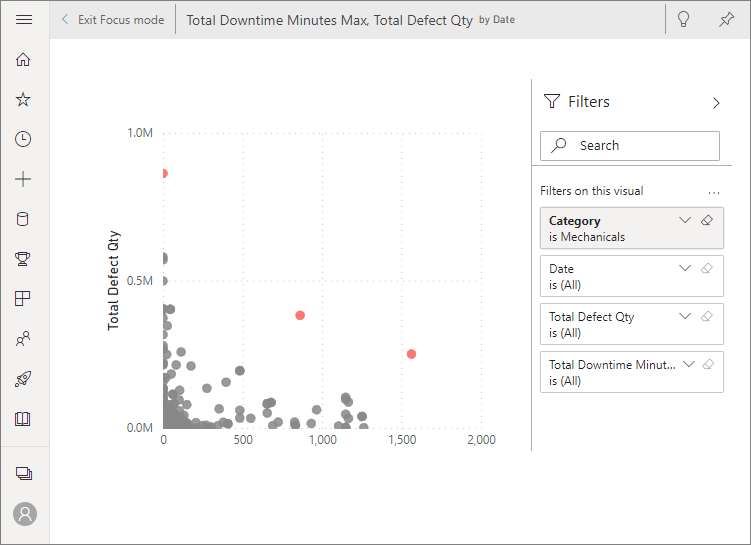
Pin the insight card to a dashboard by selecting the pin icon or Pin visual.
Run insights on the card itself, which is often referred to as scoped insights. In the top-right corner, select the light bulb icon
 or Get Insights.
The insight displays on the left. New cards, based solely on the data in that single insight, display along the right.
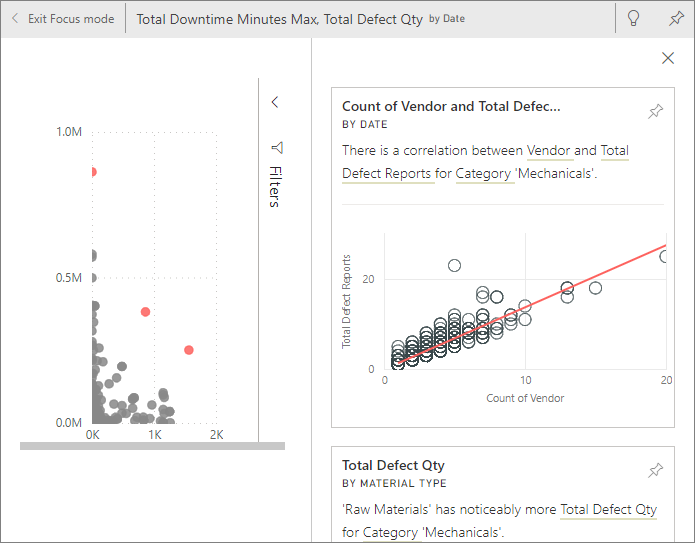
To return to the original insights canvas, in the top-left corner, select Exit Focus mode.
Related content
More questions? Ask the Power BI Community.
Feedback
Coming soon: Throughout 2024 we will be phasing out GitHub Issues as the feedback mechanism for content and replacing it with a new feedback system. For more information see: https://aka.ms/ContentUserFeedback.
Submit and view feedback for