Anomaly detection
APPLIES TO: ![]() Power BI service for consumers
Power BI service for consumers ![]() Power BI service for designers & developers
Power BI service for designers & developers ![]() Power BI Desktop
Power BI Desktop ![]() Requires Pro or Premium license
Requires Pro or Premium license
Anomaly detection helps you enhance your line charts by automatically detecting anomalies in your time series data. It also provides explanations for the anomalies to help with root cause analysis. With just a couple of clicks, you can easily find insights without slicing and dicing the data. You can create and view anomalies in both Power BI Desktop and the Power BI service. The steps and illustrations in this article are from Power BI Desktop.
Note
This video might use earlier versions of Power BI Desktop or the Power BI service.
Get started
This tutorial uses online sales data for various products. To follow along with this tutorial, download the sample file of an online-sales scenario.
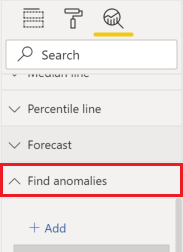
You can enable Anomaly detection by selecting the chart and selecting Find anomalies in the analytics pane.
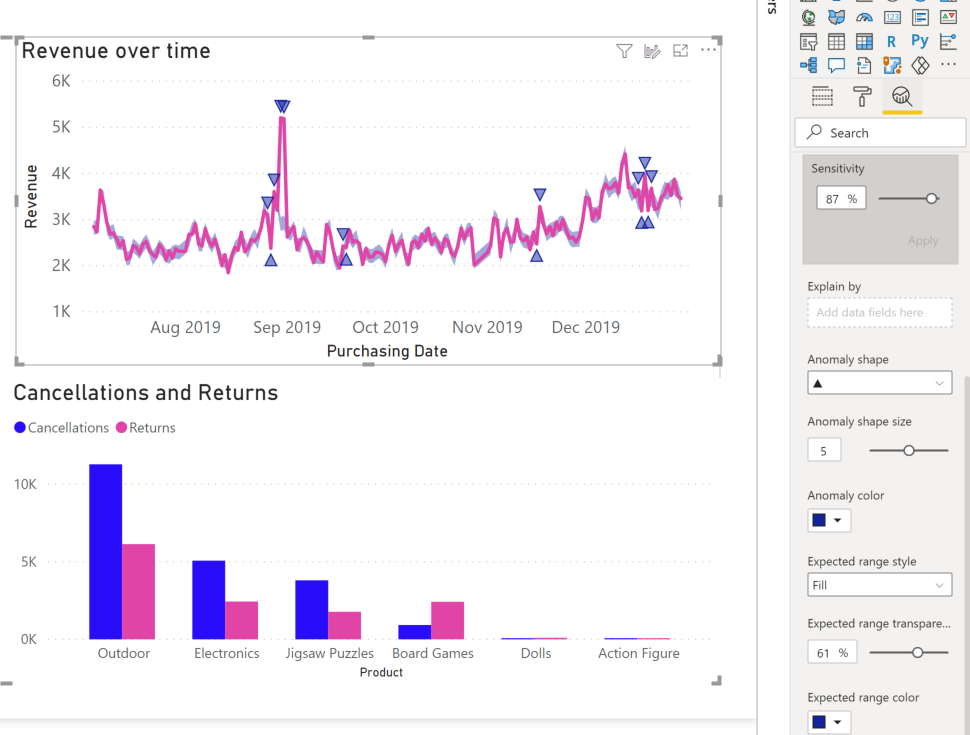
For example, this chart shows Revenue over time. Adding anomaly detection automatically enriches the chart with anomalies, and the expected range of values. When a value goes outside this expected boundary, it's marked as an anomaly. Check out this technical blog for more details about the Anomaly Detector algorithm.
Format anomalies
This experience is highly customizable. You can format the anomaly's shape, size, and color, and also the color, style, and transparency of expected range. You can also configure the parameter of the algorithm. If you increase the sensitivity, the algorithm is more sensitive to changes in your data. In that case, even a slight deviation is marked as an anomaly. If you decrease the sensitivity, the algorithm is more selective on what it considers an anomaly.
Explanations
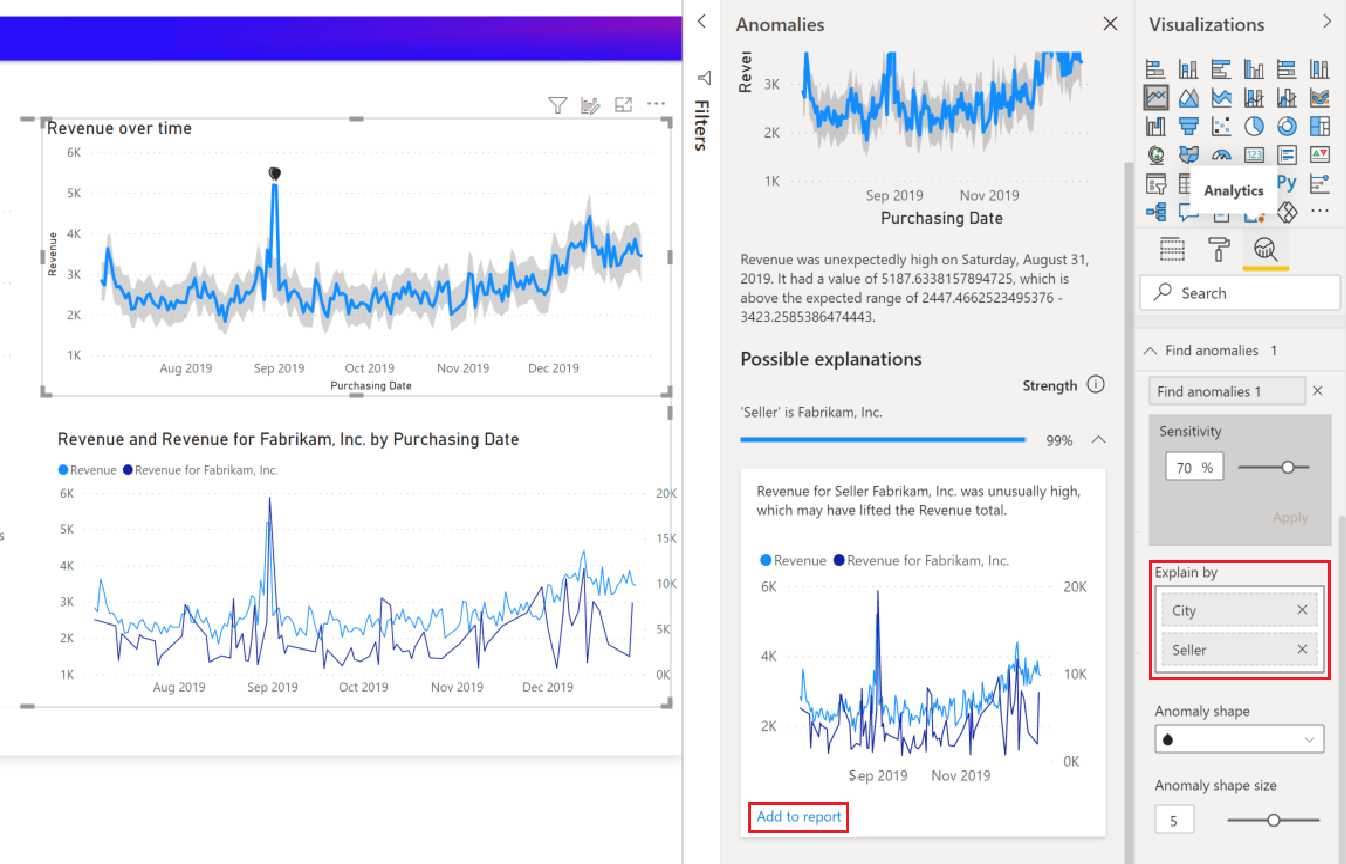
Besides detecting anomalies, you can also automatically explain the anomalies in the data. When you select the anomaly, Power BI runs an analysis across fields in your data model to figure out possible explanations. It gives you a natural language explanation of the anomaly, and factors associated with that anomaly, sorted by its explanatory strength. Here I see that on August 30, Revenue was $5187, which is above the expected range of $2447 to $3423. I can open the cards in this pane to see more details of the explanation.
Configure explanations
You can also control the fields that are used for analysis. For example, by dragging Seller and City into the Explain by field well, Power BI restricts the analysis to just those fields. In this case, the anomaly on August 31 seems to be associated with a particular seller and particular cities. Here, seller "Fabrikam" has a strength of 99%. Power BI calculates strength as the ratio of the deviation from expected value, when filtered by the dimension to the deviation in total value. For example, it's the ratio of actual minus expected value, between the component time series Fabrikam and the aggregate time series overall Revenue for the anomaly point. Opening this card shows the visual with a spike in the revenue for this seller on August 31. Use the Add to report option to add this visual to the page.
Considerations and limitations
- Anomaly detection is only supported for line chart visuals containing time series data in the Axis field.
- Anomaly detection isn't supported with legends, multiple values or secondary values in line chart visual.
- Anomaly detection requires at least four data points.
- Forecast/Min/Max/Average/ Median/Percentile lines don't work with Anomaly detection.
- Direct Query over SAP data source, Power BI Report Server, Live Connection to Azure Analysis Services and SQL Server Analysis Services aren't supported.
- Anomaly Explanations don't work with 'Show Value As' options.
- Drilling down to go to the next level in the hierarchy isn't supported.
Related content
To learn more about the algorithm that runs anomaly detection, see Tony Xing's post on the SR-CNN algorithm in Azure Anomaly Detector
Feedback
Coming soon: Throughout 2024 we will be phasing out GitHub Issues as the feedback mechanism for content and replacing it with a new feedback system. For more information see: https://aka.ms/ContentUserFeedback.
Submit and view feedback for