View data insights on dashboard tiles with Power BI
APPLIES TO: ![]() Power BI service for business users
Power BI service for business users ![]() Power BI service for designers & developers
Power BI service for designers & developers ![]() Power BI Desktop
Power BI Desktop ![]() Requires Pro or Premium license
Requires Pro or Premium license
Each visual tile on your dashboard is a doorway into data exploration. For more information, see Dashboard tiles in Power BI. When you select a tile, it opens a report or Q&A (Q&A for Power BI Business users), where you can filter and dig into the semantic model behind the report. And when you run insights, Power BI does the data exploration for you.
When you run insights on tiles, Power BI looks at the data used to render that tile. If Power BI finds interesting facts or trends in that data, you see those facts or trends in the form of interactive visuals. Insights can run on a specific dashboard tile and you can even run insights on an insight.
The insights feature is built on a growing set of advanced analytical algorithms developed with Microsoft Research. These algorithms allow people to find insights in their data in new and intuitive ways. For more information, see Types of insights supported by Power BI. The dashboard insights feature is similar to the semantic model quick insights feature. To see how to run quick insights on an entire semantic model, see Generate data insights on your semantic model automatically with Power BI.
Run insights on a dashboard tile
When you run insights on a dashboard tile, Power BI searches just the data used to create that single dashboard tile.
Open a dashboard. For more information, see Dashboards for business users of the Power BI service.
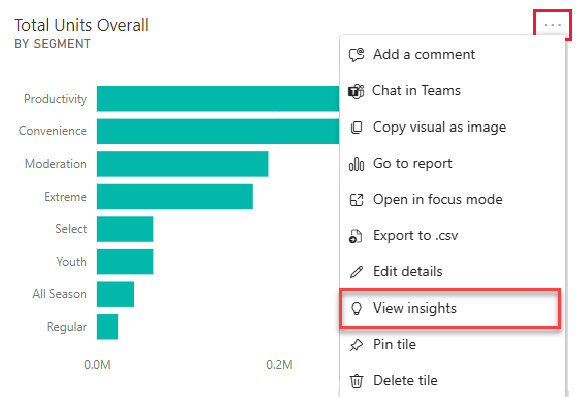
Hover over a tile, select the More options (...) feature on the tile, then choose View insights from the dropdown menu.
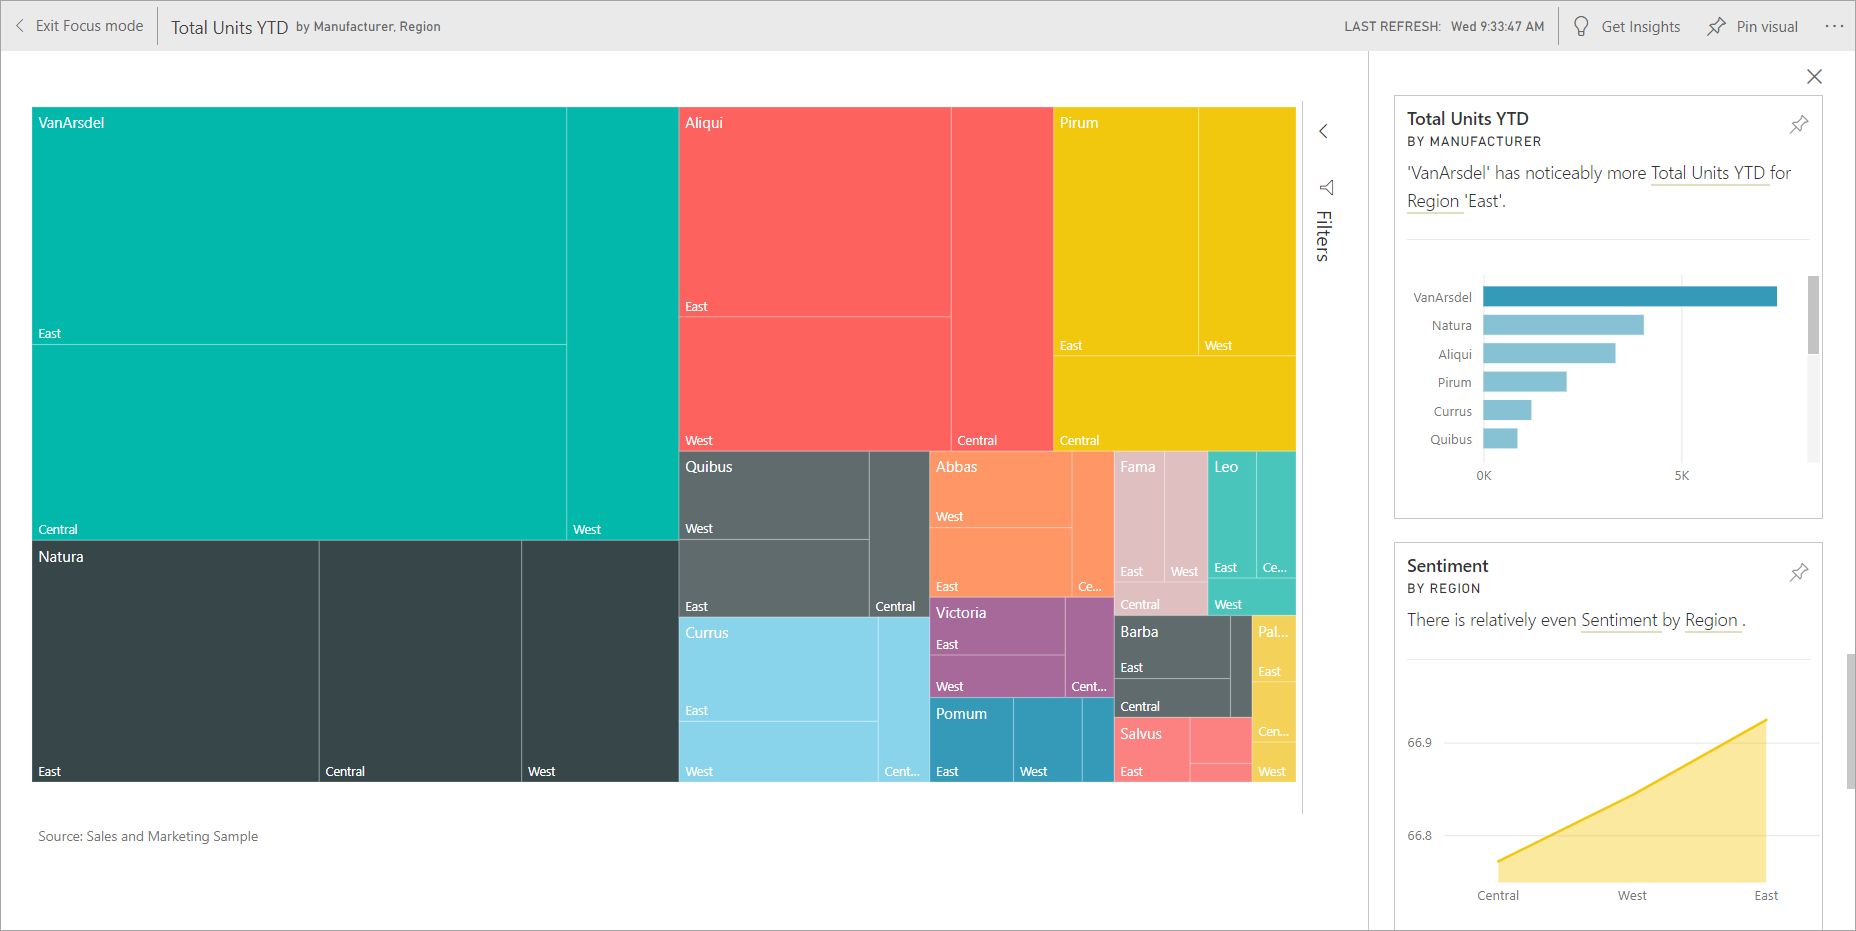
The tile opens in Focus mode with the insights cards displayed along the right. Select the pin icon to save any of these insight tiles to your dashboard. For more information, see Display content in more detail: focus mode and full screen mode.
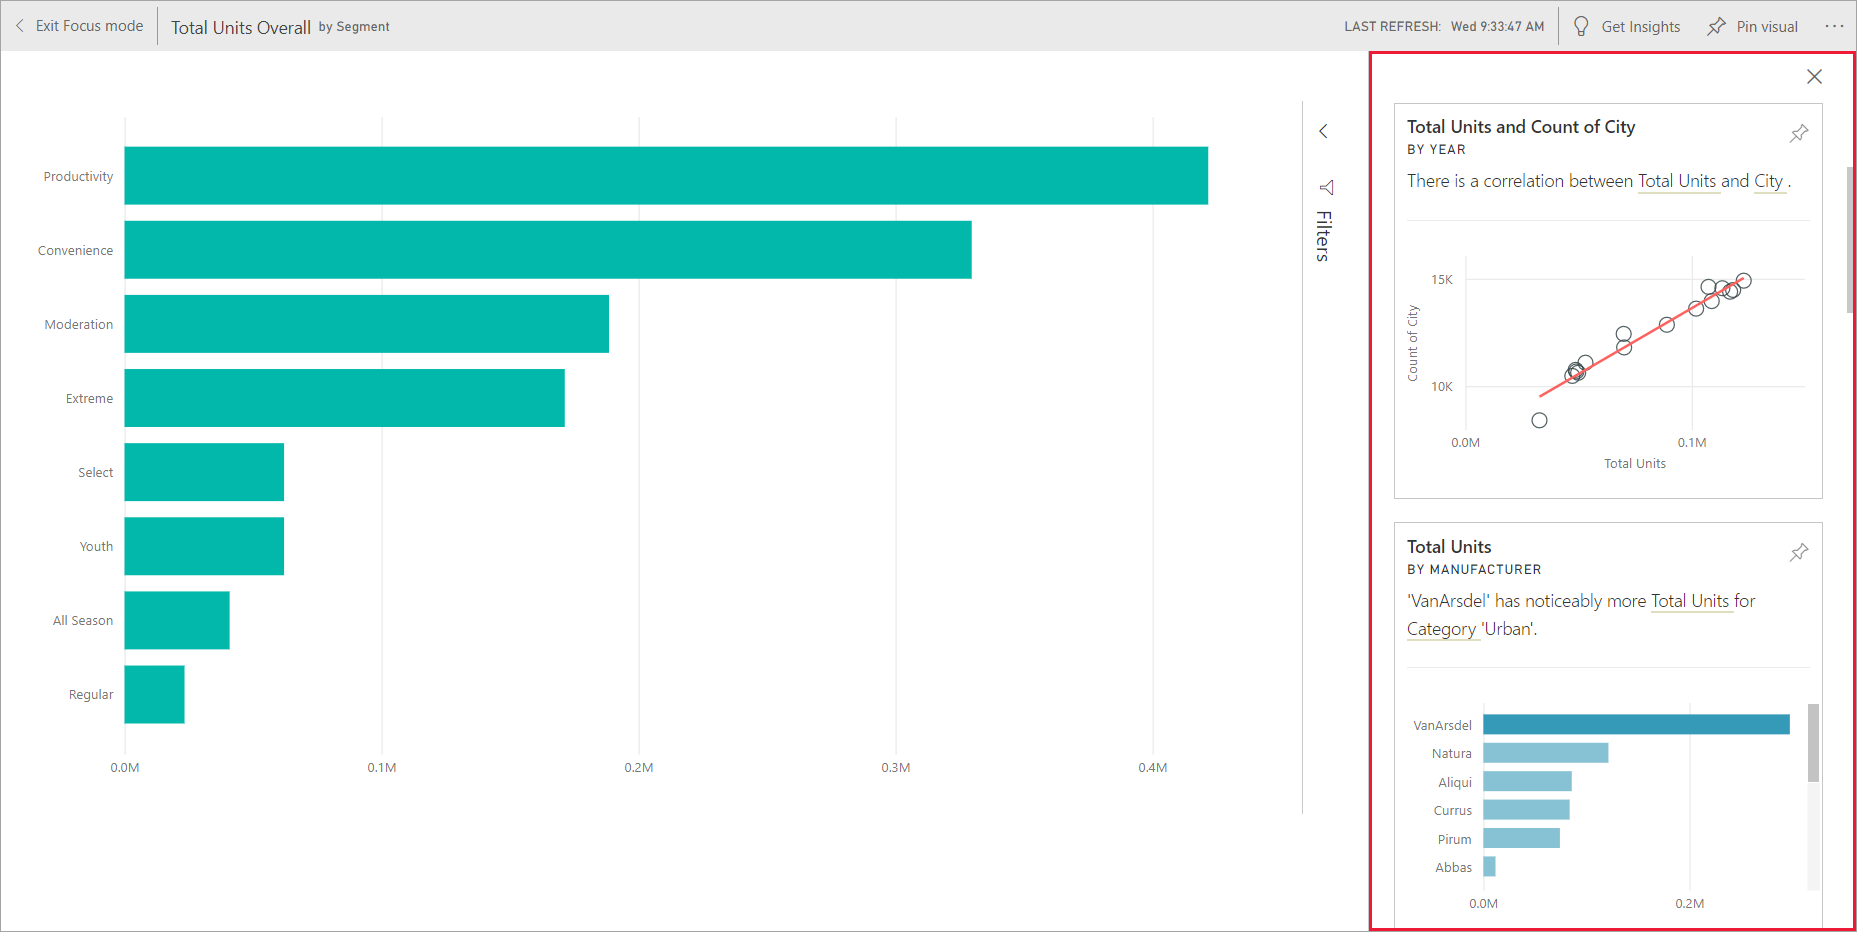
After you decide which insight card to explore, select it. The selected insight appears on the canvas, and new insight cards, based solely on the data in that single insight, display along the right.
Interact with the insight cards
Now that you have an insight open, continue exploring.
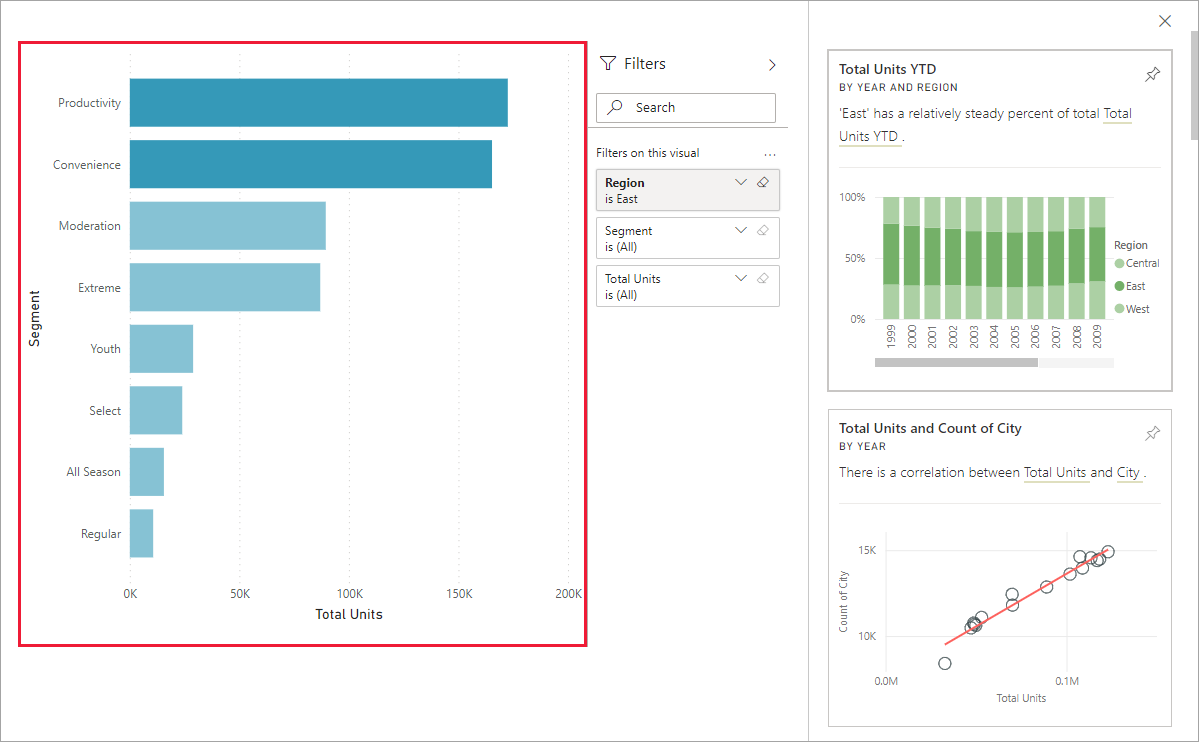
Filter the visual on the canvas. To see the filters, go to the Filter's pane and select the arrow in the upper right corner.
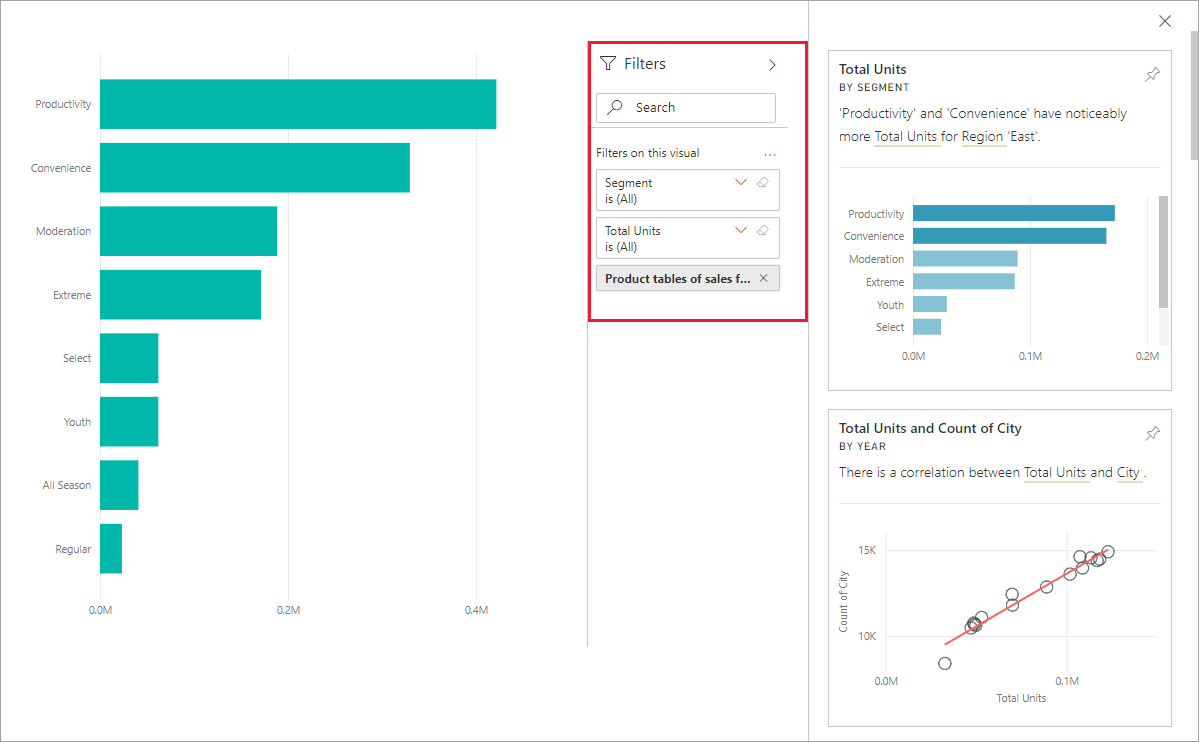
You can run insights on the insight card itself. Insights on insights is often referred to as related insights. To generate related insights, select an insight card to make it active. It moves to the left side of the report canvas, and new cards, based solely on the data in that single insight, display along the right. Filters are available for the new insight card as well.
To return to your report, select Exit Focus mode, located in the upper left corner of the screen.
Considerations and troubleshooting
View insights doesn't work with all dashboard tile types. For example, it isn't available for Power BI custom visuals, streaming data, DirectQuery tiles, or data protected with RLS (row-level security).
Related content
Feedback
Coming soon: Throughout 2024 we will be phasing out GitHub Issues as the feedback mechanism for content and replacing it with a new feedback system. For more information see: https://aka.ms/ContentUserFeedback.
Submit and view feedback for