Interact with visuals in reports, dashboards, and apps
APPLIES TO: ![]() Power BI service for business users
Power BI service for business users ![]() Power BI service for designers & developers
Power BI service for designers & developers ![]() Power BI Desktop
Power BI Desktop ![]() Requires Pro or Premium license
Requires Pro or Premium license
At its most basic, a visualization (or visual) is a chart built by Power BI designers using the data in reports and semantic models.
You can find visuals on dashboards and in reports, and you can create them instantly using Power BI Q&A. When a designer creates a visual in a report, they can pin it to a dashboard. For more information, see Dashboard tiles in Power BI. The following example shows a dashboard with eight tiles.

Tip
We recommend reading the overview topic Basic concepts for the Power BI service business user before reading this more detailed content.
What can I do with visuals
Report and dashboard designers create and share visuals with colleagues. The designer assigns different permissions to their colleagues, depending on how each colleague uses the report or dashboard. For example, the designer can assign a developer different permissions than a business user.
The following table lists the most common tasks for a business user with links to step-by-step instructions. Business users have many options for interacting with visuals to uncover insights and make data-driven business decisions.
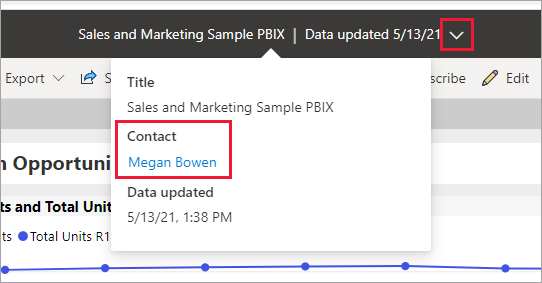
The administrator or the designer can disable your ability to see or use these features. And some of these features only work on specific visual types. If you have any questions, contact your administrator or the owner of the report or dashboard. To find the owner, select the dashboard or report dropdown.
Important
Q&A is Power BI's natural language search tool. You type a question using natural language, and Q&A answers the question in the form of a visual. Q&A allows business users to create their own visuals instantly. However, you can't save the visuals you create with Q&A. But if there's something specific you want to learn from the data, and the designer didn't include it in a report or on a dashboard, Q&A is a great option. For more information, see Q&A for Power BI business users.
Related content
Feedback
Coming soon: Throughout 2024 we will be phasing out GitHub Issues as the feedback mechanism for content and replacing it with a new feedback system. For more information see: https://aka.ms/ContentUserFeedback.
Submit and view feedback for