Enter data directly into a paginated report in Report Builder
APPLIES TO: ![]() Power BI Report Builder
Power BI Report Builder ![]() Power BI Desktop
Power BI Desktop
This article explains a feature in Microsoft Power BI Report Builder that lets you enter data directly into a paginated report as an embedded dataset. You can type the data directly in a dataset in your report, or paste it from another program like Microsoft Excel. After you create a dataset by entering data, you can use it just like you would any other embedded dataset you've created. Plus, you can add more than one table and then use one as a filter for the other. This feature is especially useful for small, static datasets you might need to use in your report, like report parameters.
Prerequisites
License requirements for Power BI paginated reports (.rdl files) are the same as for Power BI reports (.pbix files).
- You don't need a license to download Power BI Report Builder from the Microsoft Download Center for free.
- With a free license, you can publish paginated reports to My Workspace in the Power BI service. For more information, see Feature availability for users with free licenses in the Power BI service.
- With a Power BI Pro license or a PPU license, you can publish paginated reports to other workspaces. You also need at least a contributor role in the workspace.
- You need Build permission for the dataset.
- To save your paginated report to a report server, you need permissions to edit the RsReportServer.config file.
Create a data source and dataset
After you download and install Report Builder, follow the same workflow you use to add an embedded data source and dataset to your report. In the following procedure, under Data Sources you see a new Enter Data option. You only need to set up this data source once in a report. After that, you can create multiple tables of entered data as separate datasets, all using that single data source.
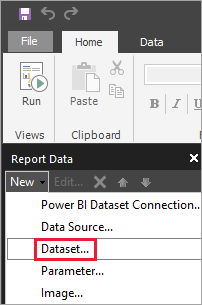
In the Report Data pane, select New > Dataset.
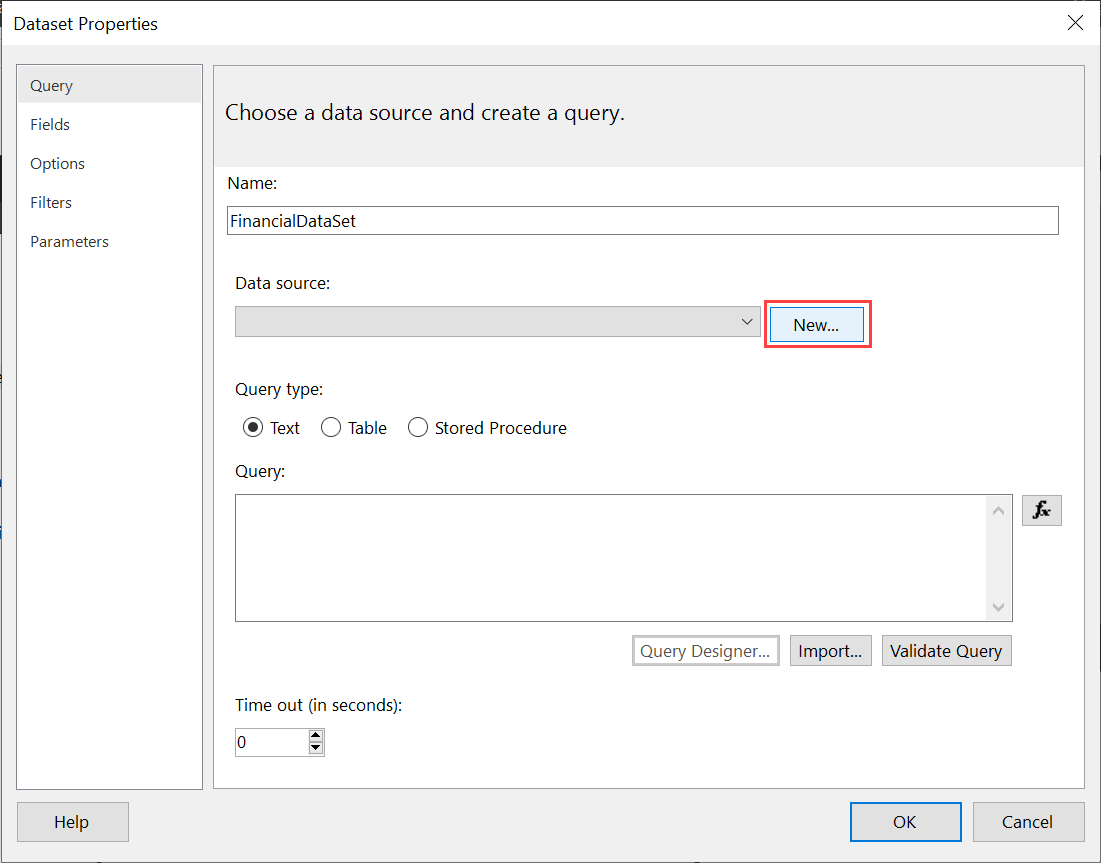
In the Dataset Properties dialog box, give your dataset a name. Don't include spaces.
Next to Data source, select New.
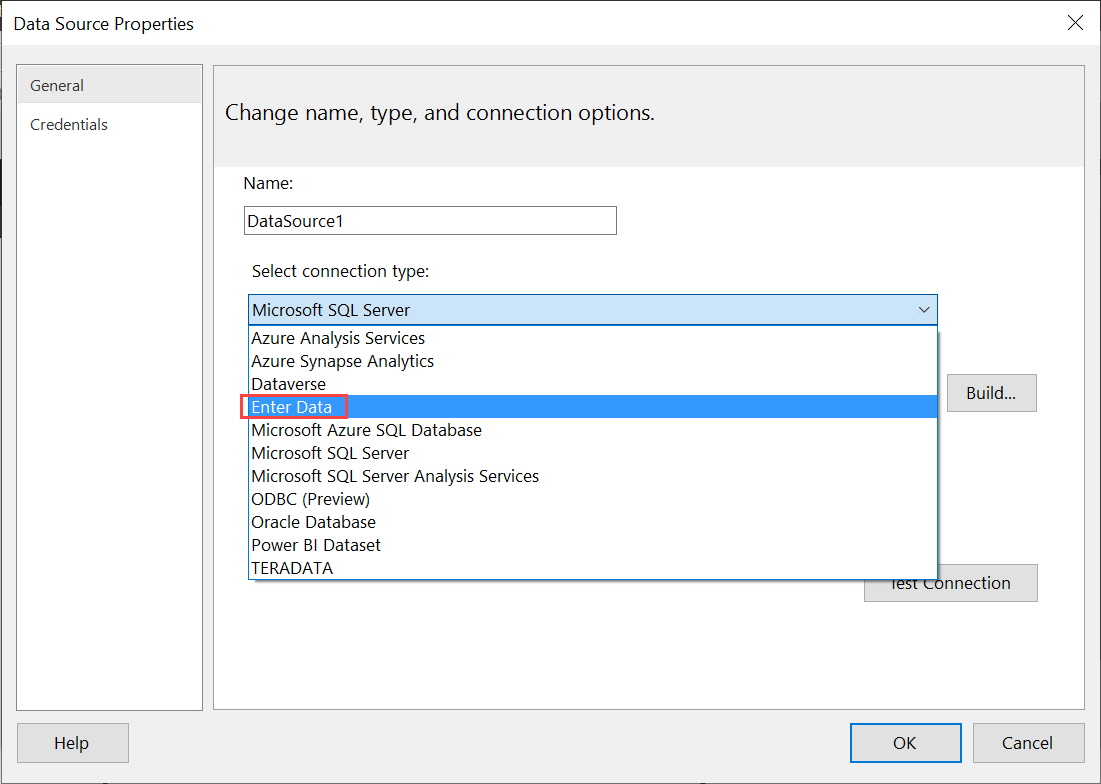
In the Select connection type box, select Enter Data > OK.
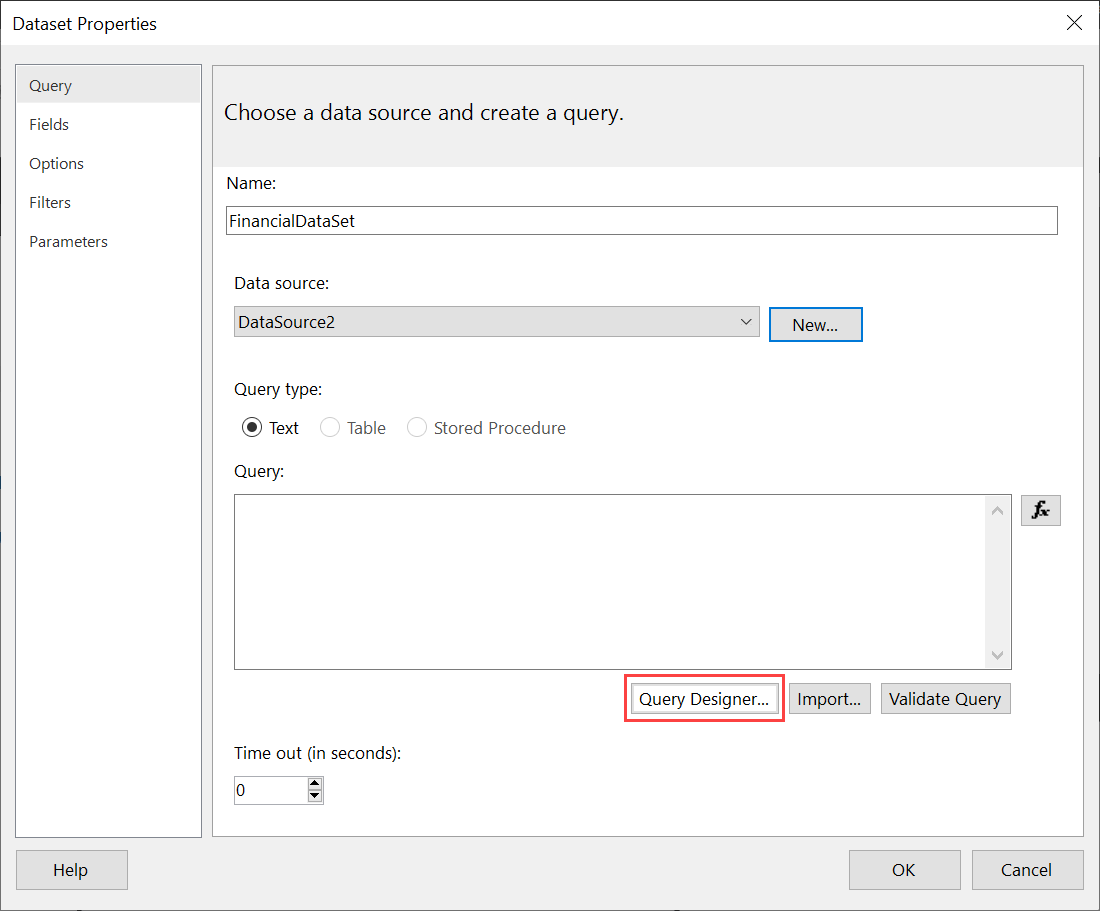
Back in the Dataset Properties dialog box, select Query Designer.
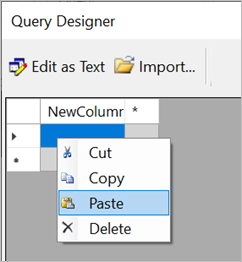
In the Query Designer pane, right-click and paste your data in the table.
To set the column names, double-click each NewColumn and type the column name.
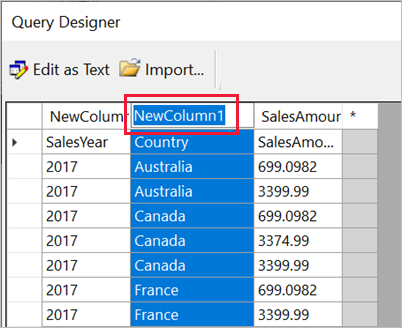
If the first row contains column headings from the original data, right-click and delete it.
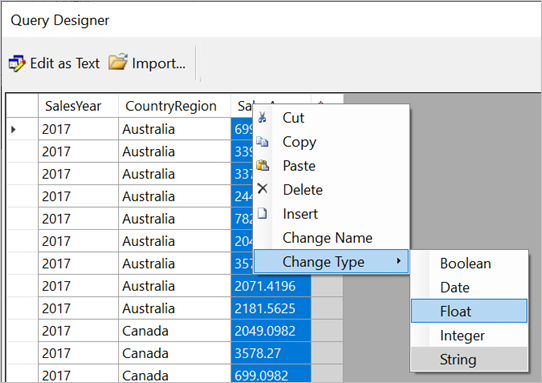
By default, the data type for each column is String. To change the data type, right-click the column header > Change Type, and set it to another data type, such as Date or Float.
When you’ve finished creating the table, select OK.
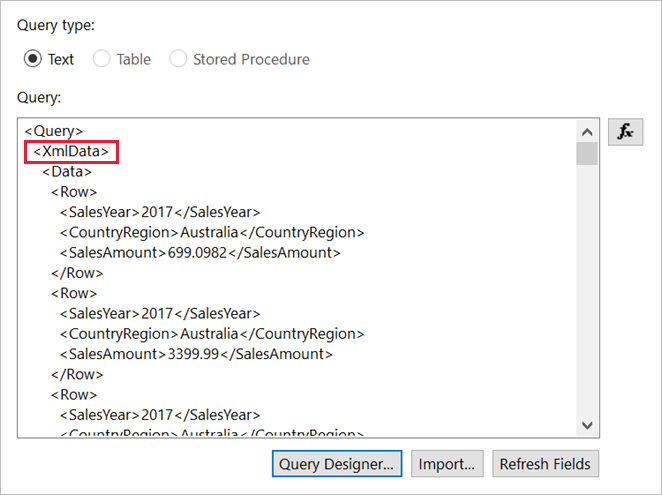
The query that’s generated is the same as you’d see with an XML data source. Under the covers, we’re using XML as the data provider. We’ve repurposed it to enable this scenario as well.
In the Dataset Properties dialog box, select OK.
You see your data source and dataset in the Report Data pane.
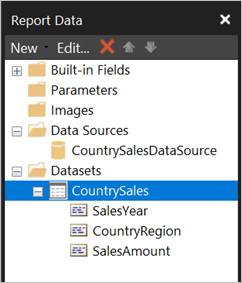
You can use your dataset as the basis for data visualizations in your report. You can also add another dataset and use the same data source for it.
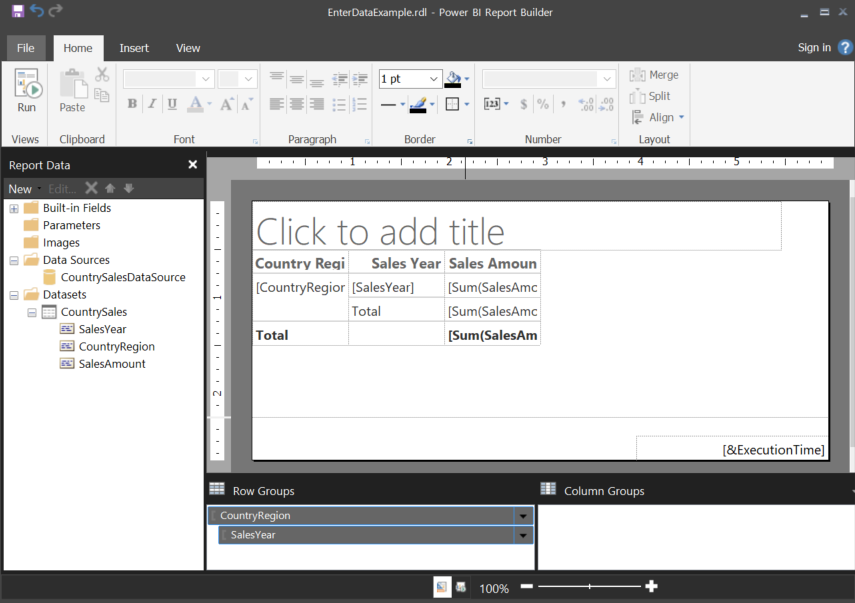
Design the report
Now that you have a data source and dataset, you're ready to create your report. The following procedure creates a simple report based on the data in the previous section.
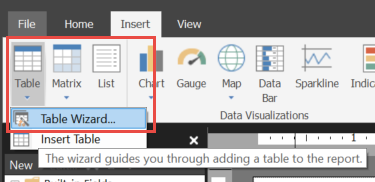
On the Insert menu, select Table > Table Wizard.
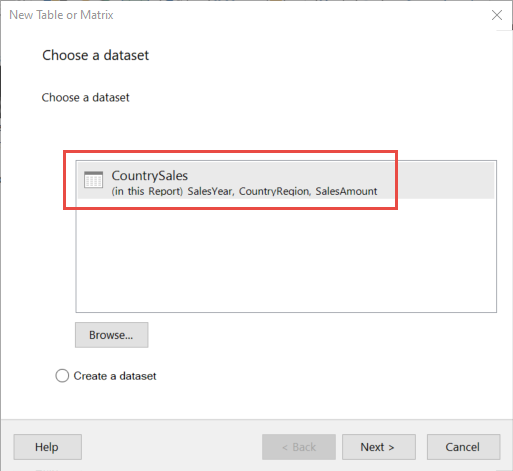
Select the dataset you just created > Next.
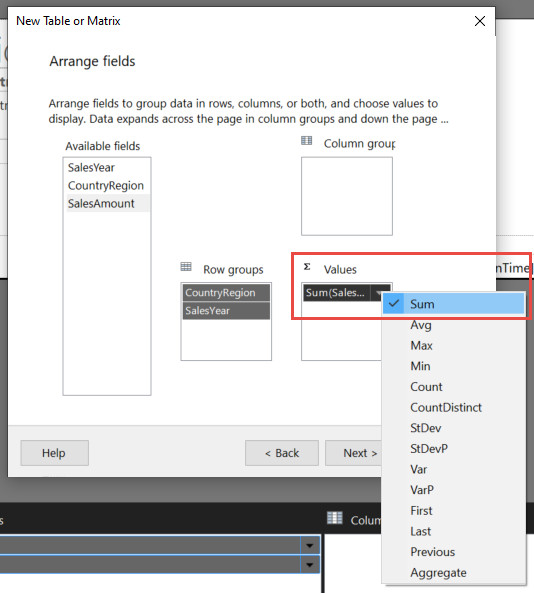
In the Arrange fields page, drag fields you want to group by from the Available fields box to the Row groups box. In this example:
- CountryRegion
- SalesYear
Drag the fields you want to aggregate from the Available fields box to the Values box. In this example:
- SalesAmount
By default, Report Builder sums the fields in the Values box, but you can choose another aggregation.
Select Next.
In the Choose the layout page, keep all the default settings, but clear Expand/collapse groups. In general, expanding and collapsing groups is great, but this time you want to see all the data.
Select Next > Finish. The table is displayed on the design surface.
Run the report
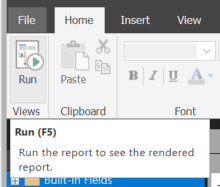
To see the actual values and preview the report, you run it.
Select Run on the Home menu.
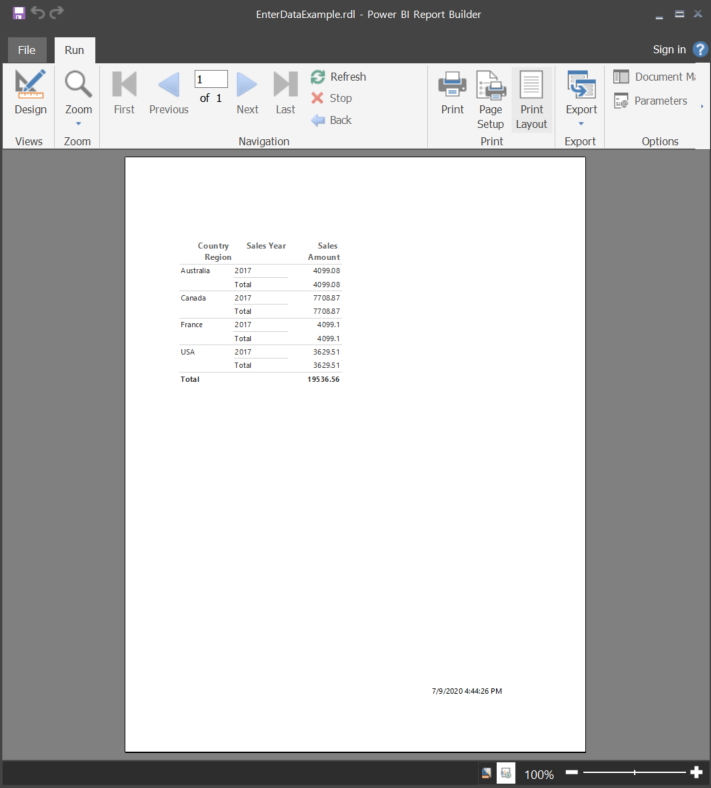
Now you see the values. The matrix has more rows than you saw in Design view! You can either format the page or decide to use the default settings before saving to your local computer or publishing to the service.
To see how your report looks when you print it, select Print Layout.

Now you see how it looks on a printed page.
Upload the paginated report to the Power BI service
Now that paginated reports are supported in the Power BI service, you can upload your paginated report to any workspace. See Upload a paginated report for details.
Upload the paginated report to a report server
You can also upload your paginated report to a Power BI Report Server or SQL Server Reporting Services 2016 or 2017 report server. Before you do, you need to add the following item to your RsReportServer.config as an additional data extension. Back up your RsReportServer.config file before you make the change, in case you run into any issues.
<Extension Name="ENTERDATA" Type="Microsoft.ReportingServices.DataExtensions.XmlDPConnection,Microsoft.ReportingServices.DataExtensions">
    <Configuration>
        <ConfigName>ENTERDATA</ConfigName>
    </Configuration>
</Extension>
After you edit it, here's what the list of data providers in the config file looks like:
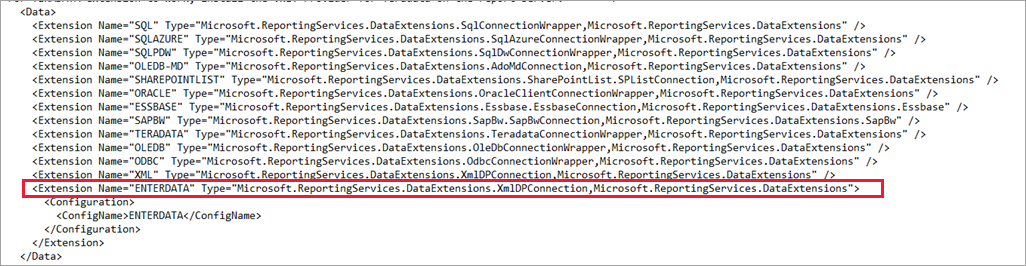
That’s it. You can now publish reports that use this new functionality to your report server.
Next steps
Feedback
Coming soon: Throughout 2024 we will be phasing out GitHub Issues as the feedback mechanism for content and replacing it with a new feedback system. For more information see: https://aka.ms/ContentUserFeedback.
Submit and view feedback for