Note
Access to this page requires authorization. You can try signing in or changing directories.
Access to this page requires authorization. You can try changing directories.
Summary
This article helps you troubleshoot recovery queuing (also called redo queuing) on a secondary replica in a SQL Server Always On availability group. It explains what the recovery queue is, how to check redo queue size and redo rate, how to interpret the values, and how to diagnose and fix common causes of redo delay, including blocked redo threads and single-threaded redo.
What recovery queuing is
Changes made to the primary replica in an availability group database are sent to every secondary replica in the same availability group. After the changes arrive at a secondary replica, they're first written (hardened) to the transaction log file of the availability group database. Microsoft SQL Server then uses the recovery or redo operation to apply those log records to the database files.
If changes arrive and harden in the transaction log faster than they can be redone, a recovery queue forms. This queue is the set of hardened log records that aren't yet applied to the database.
Symptoms and effects of recovery queuing
Stale data on secondary replicas
Read-only workloads that query secondary replicas might get stale data. If recovery queuing occurs, recent changes on the primary replica database aren't yet visible on the secondary when you query the same data.
The changes arrive at the secondary and are written to the database log file, but they aren't readable until redo applies them to the data files.
For more information, see the Data latency on secondary replica section of "Differences between availability modes for an Always On availability group."
Longer failover time or exceeded RTO
Recovery Time Objective (RTO) is the maximum database downtime that an organization can tolerate, and how quickly the organization can regain use of the database after an outage. If a large recovery queue exists on a secondary replica when a failover occurs, redo on the new primary can take longer than the RTO. After redo finishes, the database transitions to the primary role and reflects the state that existed before the failover. A longer redo time delays how quickly production resumes.
Diagnostic tools report an unhealthy availability group
When redo queuing is significant, the Always On dashboard in SQL Server Management Studio (SSMS) might show the availability group as unhealthy.
Check for recovery queuing
The recovery queue is a per-database measurement. You can check it from the Always On dashboard on the primary replica or by querying the sys.dm_hadr_database_replica_states dynamic management view (DMV) on the primary or secondary replica. Performance Monitor counters also report recovery queue size and redo rate. Check those counters on the secondary replica.
The next several sections provide methods to actively monitor your availability group database recovery queue.
Query sys.dm_hadr_database_replica_states
The sys.dm_hadr_database_replica_states DMV reports a row for each availability group database. The redo_queue_size column shows the recovery queue size in kilobytes. To monitor the trend in recovery queue size every 30 seconds, set up a query like the following one. Run it on the primary replica. It uses the is_local=0 predicate to report data for the secondary replica, where redo_queue_size and redo_rate are relevant.
WHILE 1=1
BEGIN
SELECT drcs.database_name, ars.role_desc, drs.redo_queue_size, drs.redo_rate,
ars.recovery_health_desc, ars.connected_state_desc, ars.operational_state_desc, ars.synchronization_health_desc, *
FROM sys.dm_hadr_availability_replica_states ars JOIN sys.dm_hadr_database_replica_cluster_states drcs ON ars.replica_id=drcs.replica_id
JOIN sys.dm_hadr_database_replica_states drs ON drcs.group_database_id=drs.group_database_id
WHERE ars.role_desc='SECONDARY' AND drs.is_local=0
waitfor delay '00:00:30'
END
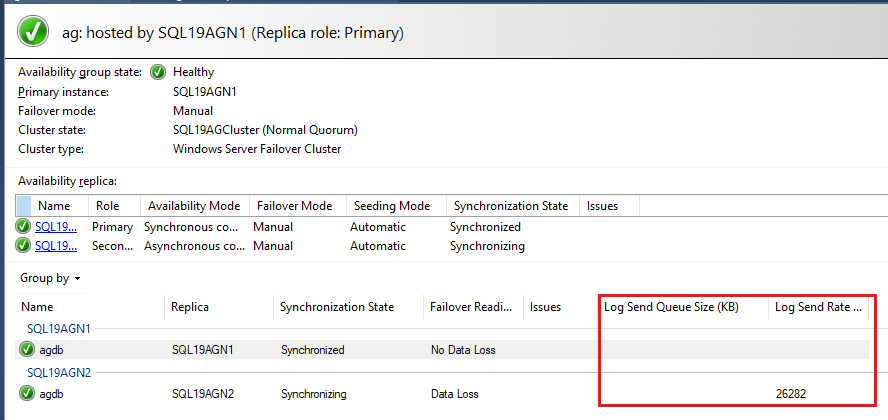
Here's what the output looks like.

Review the recovery queue in the Always On dashboard
To review the recovery queue, follow these steps:
In SSMS Object Explorer, select and hold (or right-click) an availability group to open the context menu.
Select Show Dashboard.
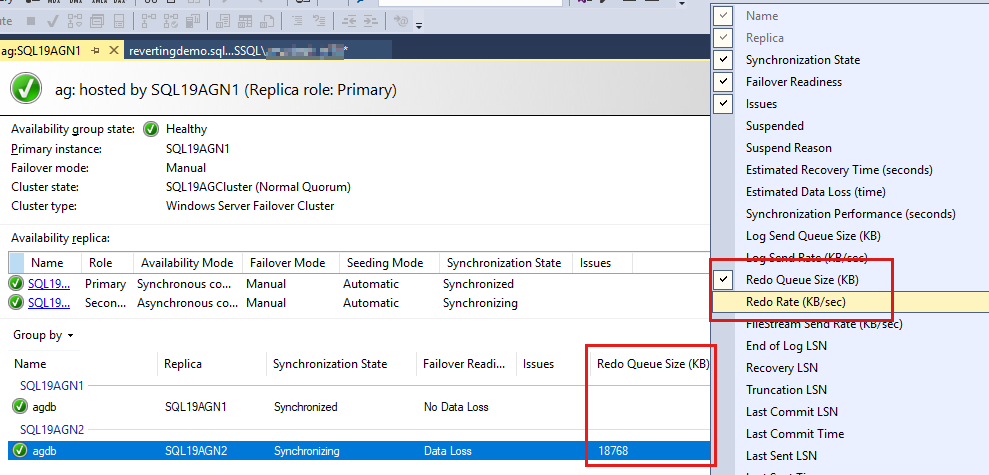
The availability group databases are listed last, with some data reported for each database. Redo Queue Size (KB) and Redo Rate (KB/sec) aren't listed by default, but you can add them to the view, as shown in the next step.
To add these counters, select and hold (or right-click) the header above the database reports, and then choose the columns to display.
To add Redo Queue Size (KB) and Redo Rate (KB/sec), select and hold (or right-click) the header that's highlighted in red in the following screenshot.
By default, the Always On dashboard auto refreshes Redo Queue Size (KB) and Redo Rate (KB/sec) every 60 seconds.


Review the recovery queue in Performance Monitor
Each secondary replica and database has its own recovery queue size. To review the recovery queue for an availability group database, follow these steps:
Open Performance Monitor on the secondary replica.
Select the Add (counter) button.
Under Available counters, select SQLServer:Database Replica, and then select the Recovery Queue and Redone Bytes/sec counters.
In the Instance list box, select the availability group database that you want to monitor for recovery queueing.
Select Add > OK.
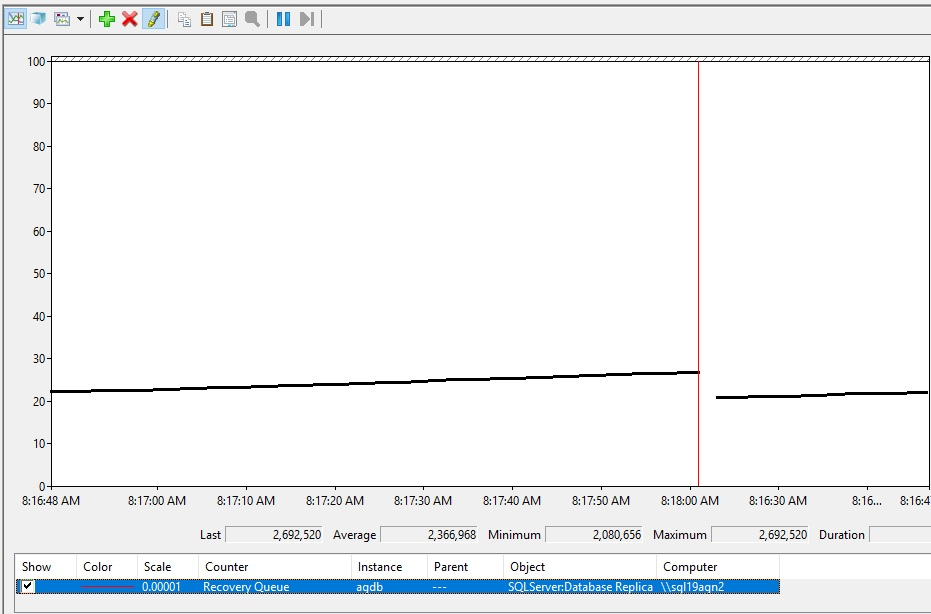
Here's what increasing recovery queueing might look like.

Interpret recovery queuing values
This section explains how to interpret the recovery queuing values you collected in the previous section.
When recovery queuing is a problem
A recovery queue value of 0 means no redo backlog at the time of the report. In a busy production environment, the recovery queue often reports a nonzero value even when the availability group is healthy. During typical production, expect the value to fluctuate between 0 and a nonzero value.
If the recovery queue grows over time, investigate further. Growth indicates that something changed. When you see sudden growth, the following measurements are useful for troubleshooting:
- Log Redo Rate (KB/sec) (Always On dashboard)
redo_rateinsys.dm_hadr_database_replica_states
Establish baseline recovery rates
During healthy Always On performance, monitor the redo rate on your busy availability group databases. Capture rates during typical business hours and during maintenance windows when large transactions (like index rebuilds or ETL processes) drive higher throughput. Compare those baselines when you see recovery queue growth to identify what changed. The workload might be larger than usual, or the redo rate might be lower than expected, which needs further investigation.
Account for workload volume
Large workloads (like an UPDATE statement against one million rows, an index rebuild on a 1-TB table, or an ETL batch that inserts millions of rows) typically cause some recovery queue growth, either immediately or over time. This growth is expected when many changes are made suddenly in the availability group database.
Diagnose recovery queuing
After you identify recovery queuing for a specific secondary replica availability group database, connect to the secondary replica, and then query sys.dm_exec_requests to check the wait_type and wait_time for recovery threads. You're looking for a high frequency of one or more wait types and large wait times for those wait types. The following sample query runs every five seconds and reports wait types and wait times for the availability group database agdb:
WHILE (1=1)
BEGIN
SELECT db_name(database_id) AS dbname, command, session_id, database_id, wait_type, wait_time,
os.runnable_tasks_count, os.pending_disk_io_count FROM sys.dm_exec_requests der JOIN sys.dm_os_schedulers os
ON der.scheduler_id=os.scheduler_id
WHERE command IN('PARALLEL REDO HELP TASK', 'PARALLEL REDO TASK', 'DB STARTUP')
AND database_id= db_id('agdb')
waitfor delay '00:00:05.000'
END
Important
For meaningful wait type output, the recovery queue should be growing when you collect this data using one of the methods described earlier.
In the following example, some I/O-related wait types are reported (PAGEIOLATCH_UP, PAGEIOLATCH_EX). Monitor whether these wait types continue to show the largest wait_time values, as reported in the next column.

Identify recovery wait types
After you identify a wait type, use Availability group secondary replica redo model and performance as a cross-reference for common wait types that cause recovery queuing and for guidance on how to fix the problem.
Blocked recovery threads on read-only secondary replicas
If your solution directs reporting (querying) against availability group databases on a secondary replica, those read-only queries acquire schema stability (Sch-S) locks. Sch-S locks can block redo threads from acquiring schema modification (Sch-M) locks (also known as schema modify locks, or LCK_M_SCH_M) needed to apply data definition language (DDL) changes like ALTER TABLE or ALTER INDEX. A blocked redo thread can't apply log records until it's unblocked, which causes recovery queuing.
To check for historical evidence of a blocked redo, open the AlwaysOn_health extended events trace files on the secondary replica by using SSMS. Look for lock_redo_blocked events.

Use Performance Monitor to actively monitor the impact of blocked redo on the recovery queue. Add the SQL Server:Database Replica\Redo blocked/sec and SQL Server:Database Replica\Recovery Queue counters. The following screenshot shows an ALTER TABLE ALTER COLUMN command run against the primary replica while a long-running query runs against the same table on the secondary replica. The Redo blocked/sec counter spikes when the ALTER TABLE ALTER COLUMN command runs. While the long-running query is active on the same table on the secondary replica, any subsequent changes on the primary increase the recovery queue.

Monitor for the schema modification lock wait type that the redo thread tries to acquire. Use the earlier query to check the wait types reported for redo operations in sys.dm_exec_requests. You can see the wait time for LCK_M_SCH_M increase while the redo is blocked.

Single-threaded recovery
SQL Server 2016 introduced parallel recovery for secondary replica databases. If you're running an earlier version, like SQL Server 2014 or SQL Server 2012, upgrade to a supported version to get parallel redo and improved redo performance.
Single-threaded redo can still occur in SQL Server 2016 through SQL Server 2019, which use the parallel recovery architecture. In those versions, a SQL Server instance can use up to 100 threads for parallel redo. The system allocates parallel redo threads across availability group databases based on the number of processors and databases, up to that 100-thread total. When the 100-thread limit is reached, the system assigns some databases in the availability group a single redo thread.
To check whether your availability group database is using parallel recovery, connect to the secondary replica and run the following query to count the rows (threads) that apply recovery for the database. In the following example, if the agdb database has a single row and its command is DB STARTUP, the recovery workload might benefit from parallel recovery.
SELECT db_name(database_id) AS dbname, command, session_id, database_id, wait_type, wait_time,
os.runnable_tasks_count, os.pending_disk_io_count FROM sys.dm_exec_requests der JOIN sys.dm_os_schedulers os
ON der.scheduler_id=os.scheduler_id
WHERE command IN ('PARALLEL REDO HELP TASK', 'PARALLEL REDO TASK', 'DB STARTUP')
AND database_id= db_id('agdb')

If your database uses single-threaded redo, review the earlier algorithm to check whether SQL Server is exceeding the 100 worker threads dedicated for parallel recovery. Reaching that limit can be the reason agdb is using only a single redo thread.
SQL Server 2022 and later use a parallel recovery algorithm that assigns worker threads based on workload, which removes the chance that a busy database stays on single-threaded redo. For more information, see the Thread usage by availability groups section of "Prerequisites, restrictions, and recommendations for Always On availability groups."