Note
Access to this page requires authorization. You can try signing in or changing directories.
Access to this page requires authorization. You can try changing directories.
This guide walks you through configuring container network logs in Advanced Container Networking Services for Azure Kubernetes Service (AKS). You can set up stored logs for continuous collection with persistent storage, or on-demand logs for real-time troubleshooting.
For an overview of what container network logs capture and when to use each mode, see What are container network logs?.
Important
Container network logs are generated by ACNS itself, so log generation does not have a hard dependency on Azure Monitor. Once ACNS is enabled and you apply a ContainerNetworkLog CRD, flow logs are written to each node at /var/log/acns/hubble/events.log.
For a complete, production-grade observability experience, we recommend enabling the Azure Monitor add-on. It collects host-local logs into a Log Analytics workspace and unlocks long-term retention, KQL, the built-in Azure portal dashboards, and managed Grafana dashboards.
If you don't enable Azure Monitor, you can still consume host-local logs directly or forward them to any OpenTelemetry-compatible collector or logging service.
Prerequisites
- An Azure account with an active subscription. If you don't have one, create a free account before you begin.
Use the Bash environment in Azure Cloud Shell. For more information, see Get started with Azure Cloud Shell.

If you prefer to run CLI reference commands locally, install the Azure CLI. If you're running on Windows or macOS, consider running Azure CLI in a Docker container. For more information, see How to run the Azure CLI in a Docker container.
If you're using a local installation, sign in to the Azure CLI by using the az login command. To finish the authentication process, follow the steps displayed in your terminal. For other sign-in options, see Authenticate to Azure using Azure CLI.
When you're prompted, install the Azure CLI extension on first use. For more information about extensions, see Use and manage extensions with the Azure CLI.
Run az version to find the version and dependent libraries that are installed. To upgrade to the latest version, run az upgrade.
Azure CLI version 2.85.0 or later. Run
az --versionto check. To install or upgrade, see Install Azure CLI.The
aks-previewAzure CLI extension version20.0.0b4or later:# Install the aks-preview extension az extension add --name aks-preview # Update the extension to make sure you have the latest version installed az extension update --name aks-previewStored logs mode requires the Cilium data plane.
On-demand logs mode works with both Cilium and non-Cilium data planes.
Your cluster must be running Kubernetes version 1.33 or later.
Layer 7 flow data is captured only when Layer 7 policy support is enabled. For more information, see Configure a Layer 7 policy.
DNS flows and metrics are captured only when a Cilium FQDN network policy is applied. For more information, see Configure an FQDN policy.
Configure stored logs mode
Stored logs mode lets ACNS continuously capture network flow logs on each node. Two things are required for logs to start flowing:
- ACNS must be enabled on the cluster. This provisions the Cilium agent components that capture flows.
- At least one
ContainerNetworkLogCRD must be applied. This defines which traffic is captured. Without a CRD, no logs are generated.
Once both are in place, flow logs are written to /var/log/acns/hubble/events.log on each node. Similar flows are automatically grouped into summarized records through flow log aggregation, which cuts data volume while preserving the patterns you need.
Enabling the Azure Monitor add-on is a separate, optional step that ships those logs into a Log Analytics workspace. It doesn't affect log generation.
You can set this up on a new cluster or enable it on an existing one.
How stored logs flow end-to-end
                    ┌─────────────────────────────────────────────┐
                    │                AKS node                     │
                    │                                             │
   Pod traffic ───▶ │  Cilium agent (ACNS)                        │
                    │       │                                     │
                    │       ▼                                     │
                    │  ContainerNetworkLog CRD ── filters flows   │
                    │       │                                     │
                    │       ▼                                     │
                    │  /var/log/acns/hubble/events.log            │
                    │  (50 MB rotating, host-local)               │
                    └───────┬─────────────────────────────────────┘
                            │
              ┌─────────────┴──────────────┐
              ▼                            ▼
   Azure Monitor add-on        OpenTelemetry collector
   (optional)                  or logging service (optional)
              │                            │
              ▼                            ▼
   ContainerNetworkLogs        Your SIEM / observability
   table in Log Analytics      backend
              │
              ▼
   Azure portal / Grafana
   dashboards, KQL
Deployment options
Follow the end-to-end setup below. The same three steps work for both new and existing clusters.
End-to-end setup
Follow these steps in order. Steps 1 and 2 are required. Step 3 is optional and only needed if you want logs forwarded to Azure Monitor.
| Step | What you do | Required? |
|---|---|---|
| 1 | Make sure your cluster has ACNS enabled (new or existing) | Yes |
| 2 | Apply a ContainerNetworkLog CRD to start log collection |
Yes |
| 3 | Forward logs to Azure Monitor for persistent storage | Optional |
Set your environment variables once and reuse them throughout:
# Replace placeholders with your own values
export CLUSTER_NAME="<aks-cluster-name>"
export RESOURCE_GROUP="<aks-resource-group>"
export LOCATION="<location>"
Step 1: Make sure ACNS is enabled on your cluster
Use the option that matches your situation.
Option A: Create a new cluster with ACNS
# Create the resource group if it doesn't already exist
az group create --name $RESOURCE_GROUP --location $LOCATION

# Create an AKS cluster with ACNS
az aks create \
  --resource-group $RESOURCE_GROUP \
  --name $CLUSTER_NAME \
  --location $LOCATION \
  --pod-cidr 192.168.0.0/16 \
  --network-plugin azure \
  --network-plugin-mode overlay \
  --network-dataplane cilium \
  --generate-ssh-keys \
  --enable-acns \
  --acns-advanced-networkpolicies L7
Tip
If the default VM size isn't available in your subscription, add --node-vm-size Standard_D4ads_v5.
If you already know you want logs forwarded to Azure Monitor, you can do everything in one command. See Shortcut: Create a cluster with Log Analytics from the start.
Get your cluster credentials so you can run kubectl commands:
az aks get-credentials --name $CLUSTER_NAME --resource-group $RESOURCE_GROUP
Option B: Use an existing cluster
If your cluster already has ACNS enabled, you can skip ahead to Step 2. Otherwise, get your credentials so you can run kubectl commands:
az aks get-credentials --name $CLUSTER_NAME --resource-group $RESOURCE_GROUP
Step 2: Apply a ContainerNetworkLog CRD to start log collection
Stored logs mode doesn't collect anything until you apply at least one ContainerNetworkLog custom resource. This resource specifies which traffic to capture: by namespace, pod, service, protocol, or verdict.
Once a CRD is applied, matching flows are written to /var/log/acns/hubble/events.log on each node.
kubectl apply -f <crd.yaml>
See the full ContainerNetworkLog CRD template below for all available fields.
Tip
For a practical example, see the sample CRD in the AKS Labs documentation.
Note
Logs on host nodes are temporary. Files auto-rotate at 50 MB, and older entries are overwritten. For persistent storage, complete Step 3. You can also forward logs to a SIEM or observability backend using any OpenTelemetry-compatible collector or logging service, instead of or alongside Azure Monitor.
At this point, every node has flow records at /var/log/acns/hubble/events.log in JSON format. If that's all you need, you're done.
Step 3 (optional): Forward logs to Azure Monitor for persistent storage
Complete this step if you want logs forwarded to a Log Analytics workspace for long-term retention, KQL queries, and the built-in Azure portal and Grafana dashboards. Skip it if you plan to consume host-local logs directly or forward them through your own OpenTelemetry collector or logging service.
3a. Enable the Azure Monitor add-on (Log Analytics):
# To use the default Log Analytics workspace
az aks enable-addons -a monitoring -g $RESOURCE_GROUP -n $CLUSTER_NAME

# To use an existing Log Analytics workspace
az aks enable-addons -a monitoring -g $RESOURCE_GROUP -n $CLUSTER_NAME --workspace-resource-id <workspace-resource-id>
3b. Enable the container network logs flag:
az aks update --enable-acns \
  --enable-container-network-logs \
  -g $RESOURCE_GROUP \
  -n $CLUSTER_NAME
To send logs to a specific Azure Monitor workspace, add the --azure-monitor-workspace-resource-id flag:
az aks update --enable-acns \
  --enable-container-network-logs \
  --azure-monitor-workspace-resource-id $AZURE_MONITOR_ID \
  -g $RESOURCE_GROUP \
  -n $CLUSTER_NAME
Note
Flow logs are written to the host when the ContainerNetworkLog CRD is applied. If you enable Log Analytics integration later, the Azure Monitor Agent begins collecting from that point forward. Logs older than two minutes aren't ingested.
Shortcut: Create a cluster with Log Analytics from the start
If you're creating a new cluster and already know you want logs sent to a Log Analytics workspace, you can combine Step 1 and Step 3 into a single create command:
az aks create \
  --resource-group $RESOURCE_GROUP \
  --name $CLUSTER_NAME \
  --location $LOCATION \
  --pod-cidr 192.168.0.0/16 \
  --network-plugin azure \
  --network-plugin-mode overlay \
  --network-dataplane cilium \
  --generate-ssh-keys \
  --enable-acns \
  --enable-addons monitoring \
  --enable-container-network-logs \
  --acns-advanced-networkpolicies L7
To send logs to a specific workspace, add the --azure-monitor-workspace-resource-id flag:
az aks create \
  --resource-group $RESOURCE_GROUP \
  --name $CLUSTER_NAME \
  --location $LOCATION \
  --pod-cidr 192.168.0.0/16 \
  --network-plugin azure \
  --network-plugin-mode overlay \
  --network-dataplane cilium \
  --generate-ssh-keys \
  --enable-acns \
  --enable-addons monitoring \
  --enable-container-network-logs \
  --azure-monitor-workspace-resource-id $AZURE_MONITOR_ID \
  --acns-advanced-networkpolicies L7
You still need to complete Step 2 (apply a ContainerNetworkLog CRD) to define which traffic to capture. Log Analytics integration is already in place, so matched flows are collected and sent to your workspace automatically.
ContainerNetworkLog CRD template
The ContainerNetworkLog custom resource defines which network flows to capture. You can create multiple custom resources in a single cluster, and each can target different namespaces, pods, or protocols.
apiVersion: acn.azure.com/v1alpha1
kind: ContainerNetworkLog
metadata:
  name: sample-containernetworklog # Cluster scoped
spec:
  includefilters: # At least one filter is required
    - name: sample-filter
      from:
        namespacedPod: # Format: namespace/pod
          - sample-namespace/sample-pod
        labelSelector:
          matchLabels:
            app: frontend
            k8s.io/namespace: sample-namespace
          matchExpressions:
            - key: environment
              operator: In
              values:
                - production
                - staging
        ip: # Single IP or CIDR
          - "192.168.1.10"
          - "10.0.0.1"
      to:
        namespacedPod:
          - sample-namespace2/sample-pod2
        labelSelector:
          matchLabels:
            app: backend
            k8s.io/namespace: sample-namespace2
          matchExpressions:
            - key: tier
              operator: NotIn
              values:
                - dev
        ip:
          - "192.168.1.20"
          - "10.0.1.1"
      protocol: # tcp, udp, dns
        - tcp
        - udp
        - dns
      verdict: # forwarded, dropped
        - forwarded
        - dropped
Just create a YAML file with the above template, customize the filters as needed, and apply it with kubectl apply -f <crd.yaml>.
CRD field reference
| Field | Type | Description | Required |
|---|---|---|---|
includefilters |
[]filter | Filters that define which network flows to capture. Must contain at least one filter. | Yes |
filters.name |
String | Name of the filter. | No |
filters.protocol |
[]string | Protocols to match: tcp, udp, dns. If omitted, all protocols are included. |
No |
filters.verdict |
[]string | Flow verdict to match: forwarded, dropped. If omitted, all verdicts are included. |
No |
filters.from |
Endpoint | Source of the network flow. Can include IPs, label selectors, and namespace/pod pairs. | No |
filters.to |
Endpoint | Destination of the network flow. Same options as from. |
No |
Endpoint.ip |
[]string | Single IP address or CIDR range. | No |
Endpoint.labelSelector |
Object | Standard Kubernetes label selector with matchLabels and matchExpressions. Conditions are combined with AND. If empty, matches all resources. |
No |
Endpoint.namespacedPod |
[]string | Namespace/pod pairs in namespace/pod format. |
No |
Capture Layer 7 and DNS flows
The ContainerNetworkLog CRD captures Layer 3 and Layer 4 flows for the traffic you select in includeFilters. Layer 7 (HTTP, gRPC, Kafka) and DNS records show up only when matching traffic is also covered by a Cilium network policy that opts into L7 inspection or DNS visibility. Without that policy, L7 and DNS fields stay empty in your flow logs.
You need both pieces:
- Cluster-level L7 support. L7 policy support must be enabled on the cluster. For details, see Configure a Layer 7 policy.
- A Cilium network policy that scopes L7 or DNS rules. Apply a
CiliumNetworkPolicywithrules.http,rules.kafka, orrules.dnsfor the workloads whose traffic you want to inspect. For DNS-aware egress, combinerules.dnswithtoFQDNs. For more information, see Configure an FQDN policy.
The following example enables DNS inspection for kube-dns lookups and L7 HTTP inspection for egress to *.example.com:
apiVersion: cilium.io/v2
kind: CiliumNetworkPolicy
metadata:
  name: l7-dns-policy
  namespace: default
spec:
  endpointSelector:
    matchLabels:
      app: myapp
  egress:
    - toEndpoints:
        - matchLabels:
            "k8s:io.kubernetes.pod.namespace": kube-system
            "k8s:k8s-app": kube-dns
      toPorts:
        - ports:
            - port: "53"
              protocol: UDP
          rules:
            dns:
              - matchPattern: "*.example.com"
    - toFQDNs:
        - matchPattern: "*.example.com"
      toPorts:
        - ports:
            - port: "443"
              protocol: TCP
          rules:
            http:
              - method: "GET"
                path: "/1"
Apply it:
kubectl apply -f l7-dns-policy.yaml
After the policy is applied, matching flows in ContainerNetworkLogs populate the Layer7 field, and DNS lookups appear with dns.rcode and related metadata.
Verify the setup
These steps apply to both new and existing cluster setups.
Get cluster credentials
az aks get-credentials --name $CLUSTER_NAME --resource-group $RESOURCE_GROUP
Confirm that container network logs are enabled
az aks show -g $RESOURCE_GROUP -n $CLUSTER_NAME
Look for these sections in the output:
"networkProfile": {
  "advancedNetworking": {
    "enabled": true,
    "observability": {
      "enabled": true
    }
  }
}
"osmagent": {
  "config": {
    "enableContainerNetworkLogs": "True"
  }
}
Check custom resource status
List all ContainerNetworkLog resources in the cluster:
kubectl get containernetworklog
It will give you the name of the containernetworklog resource you just created. Use that name in the command below to check its status:
Check the status of a specific resource:
kubectl describe containernetworklog <cr-name>
The Status > State field should show CONFIGURED. If it shows FAILED, check that your filter spec is valid.
Spec:
  Includefilters:
    From:
      Namespaced Pod:
        namespace/pod-
    Name:  sample-filter
    Protocol:
      tcp
    To:
      Namespaced Pod:
        namespace/pod-
    Verdict:
      dropped
Status:
  State:      CONFIGURED
  Timestamp:  2025-05-01T11:24:48Z
You can apply multiple ContainerNetworkLog custom resources. Each one has its own status.
Query logs in Log Analytics
When Log Analytics is configured, you can query historical flow logs using the ContainerNetworkLogs table in your Log Analytics workspace. Use Kusto Query Language (KQL) to analyze network patterns, identify security incidents, troubleshoot connectivity, and perform root cause analysis.
For sample queries, see Progressive diagnosis using flow logs in the AKS Labs documentation.
Visualize with Grafana dashboards
You can access prebuilt Grafana dashboards through the Azure portal. Before you start, make sure the Azure Monitor log pods are running:
kubectl get pods -o wide -n kube-system | grep ama-logs
Expected output:
ama-logs-9bxc6                                   3/3     Running   1 (39m ago)   44m
ama-logs-fd568                                   3/3     Running   1 (40m ago)   44m
ama-logs-rs-65bdd98f75-hqnd2                     2/2     Running   1 (43m ago)   22h
Grant Grafana access to monitoring data
Your Managed Grafana workspace needs the Monitoring Reader role on the subscription that contains your Log Analytics workspace.
If you're a subscription Owner or User Access Administrator, the Managed Grafana workspace gets this role automatically when it's created.
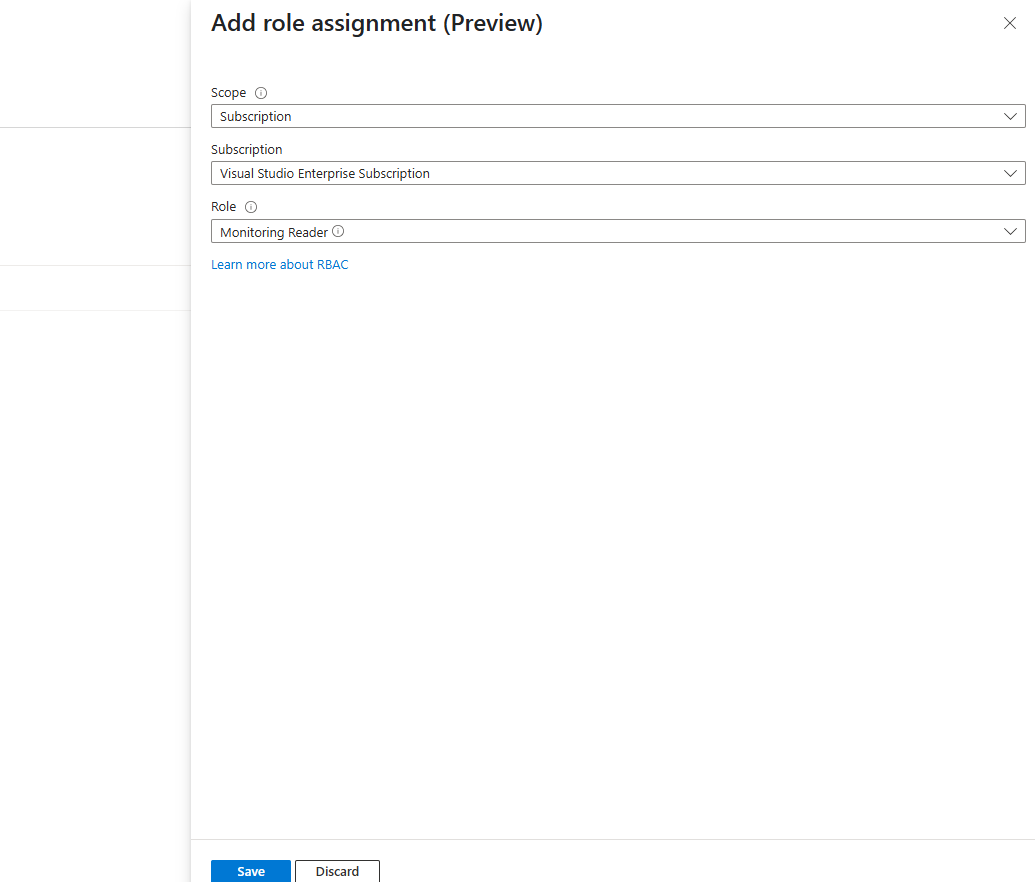
If not (or if your Log Analytics and Grafana workspaces are in different subscriptions), grant the role manually:
In your Managed Grafana workspace, go to Settings > Identity.
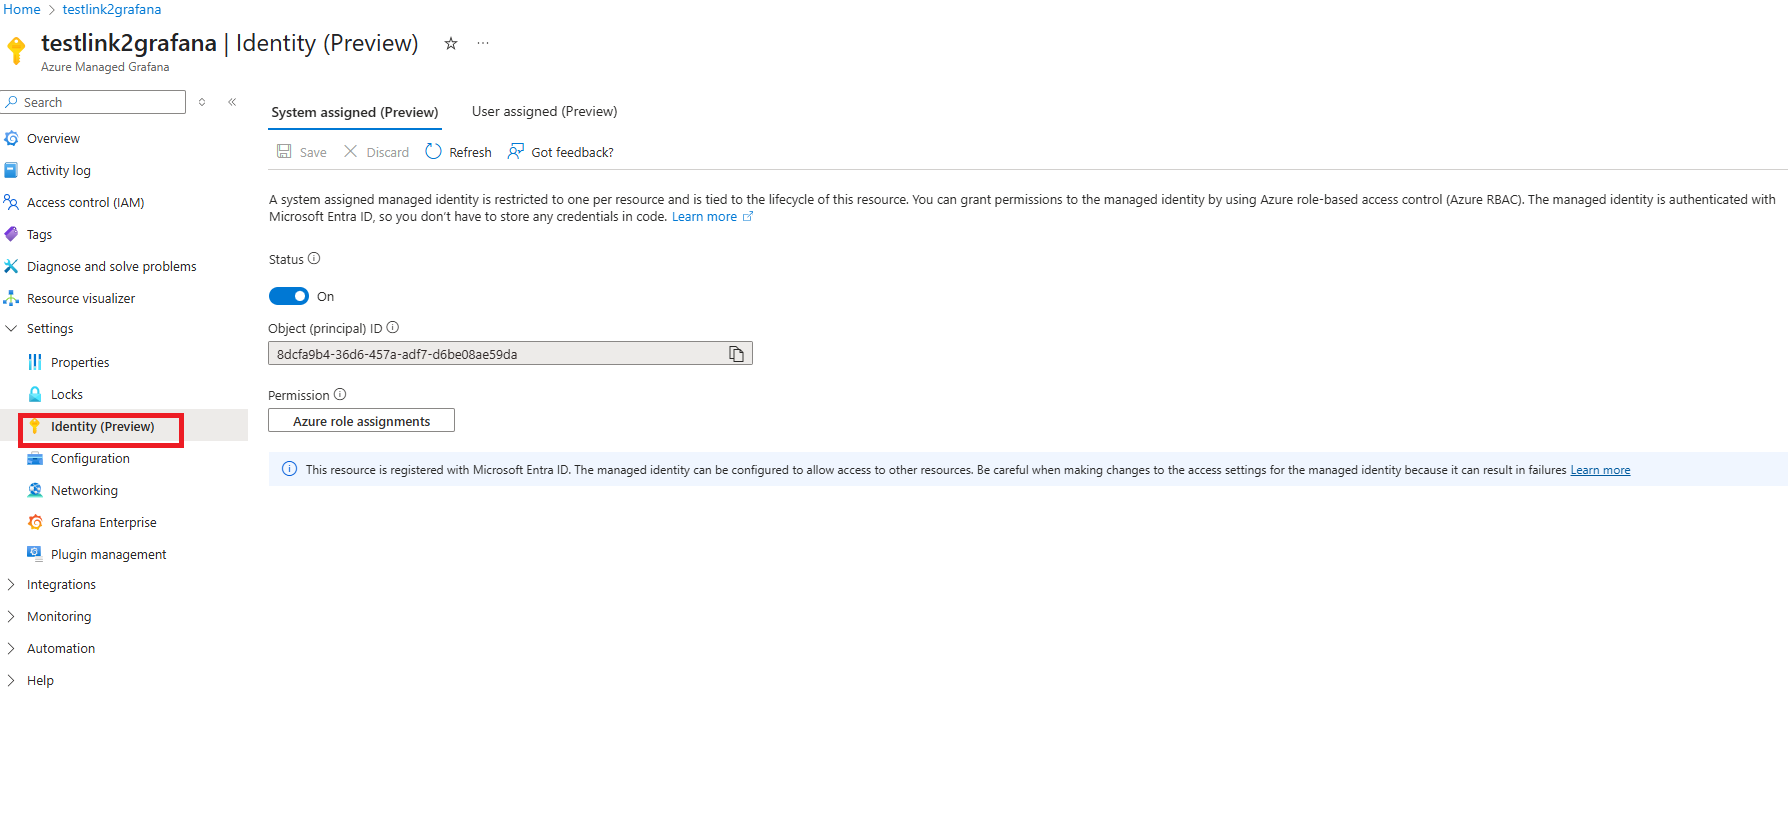
Select Azure role assignments > Add role assignments.
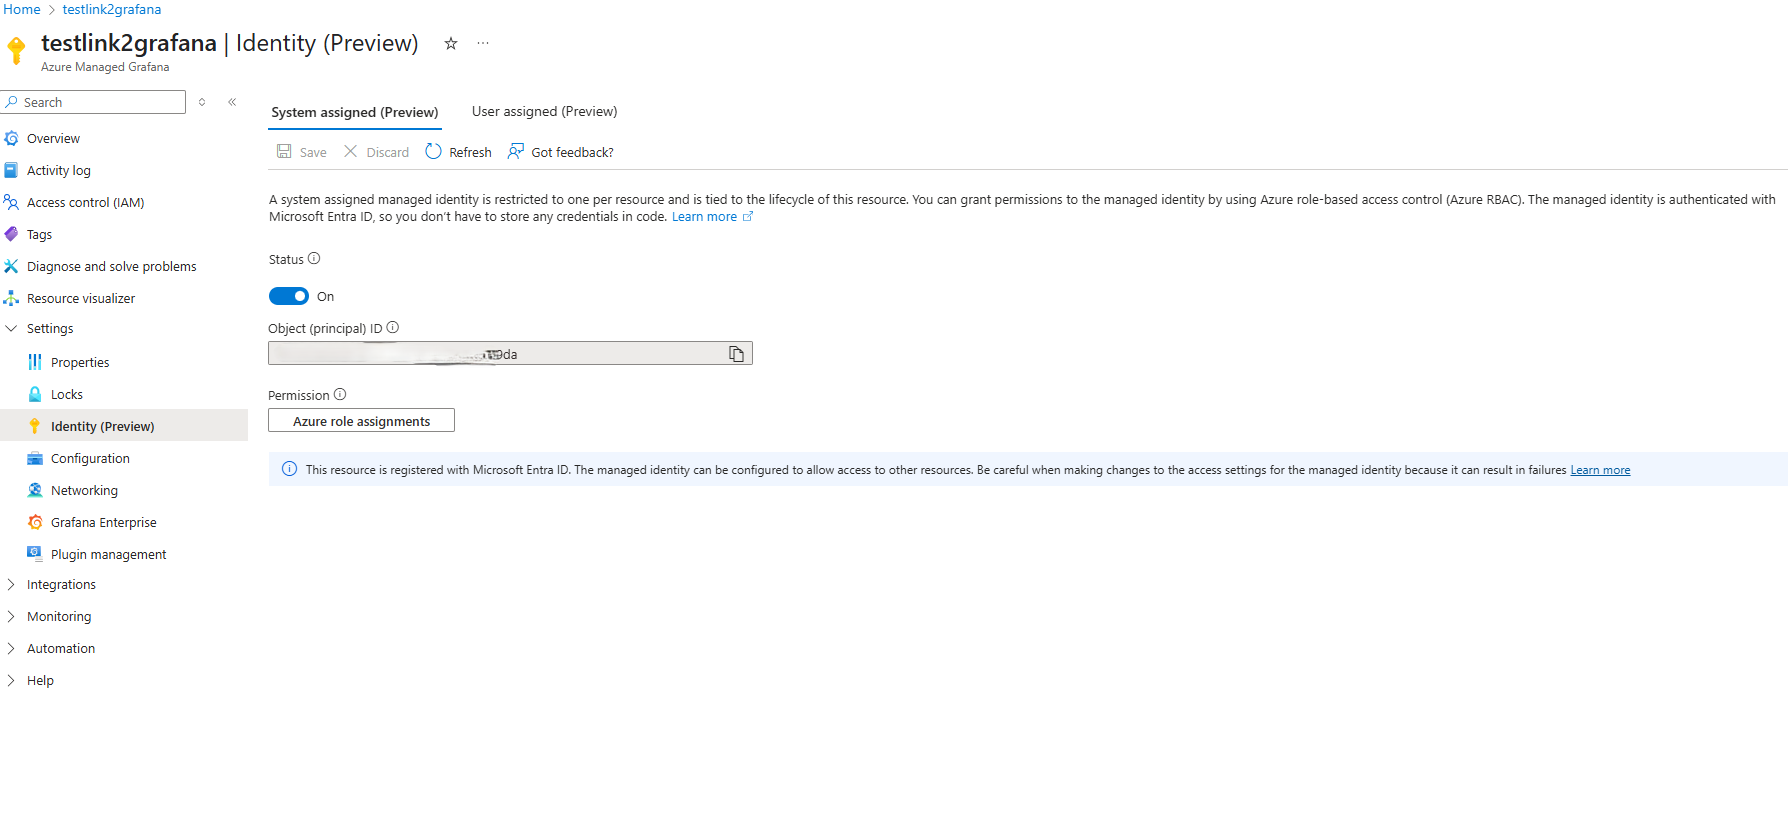
Set Scope to Subscription, select your subscription, set Role to Monitoring Reader, and select Save.
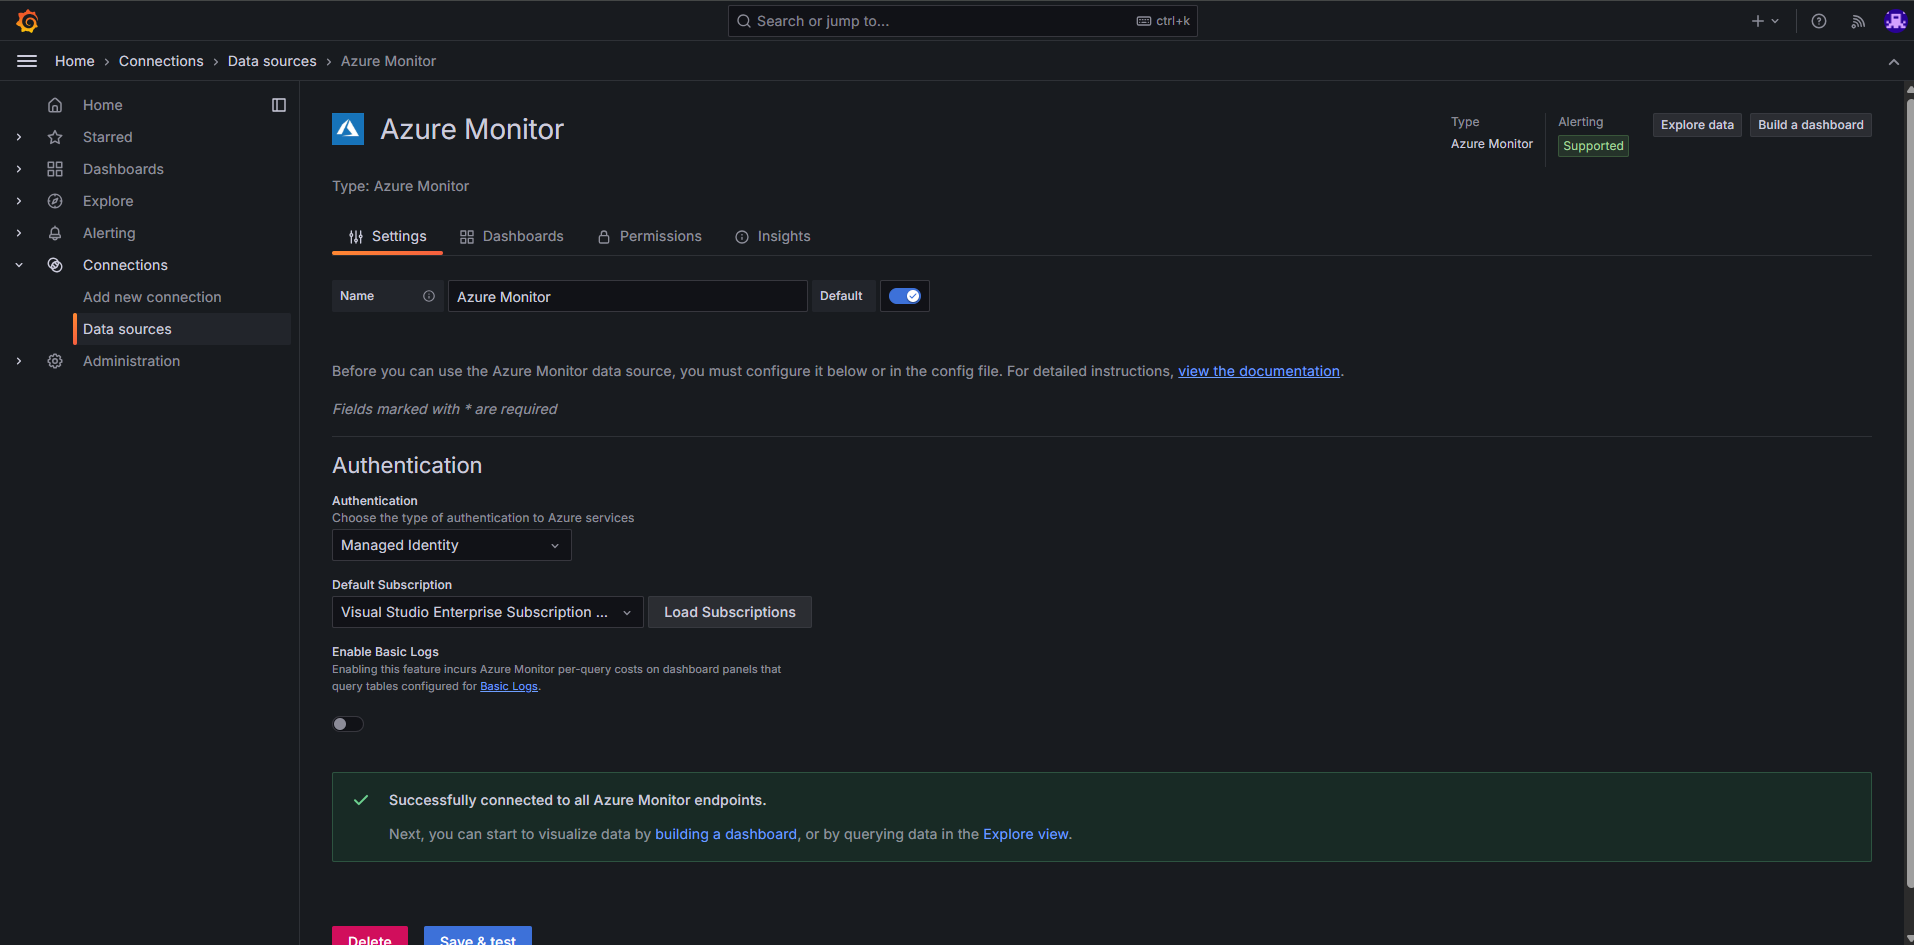
Verify the data source in the Data source tab of your Managed Grafana instance:


Access the dashboards
To open the dashboards from the Azure portal:
- Go to your AKS cluster in the Azure portal.
- Select Dashboards with Grafana (Preview).
- Browse the available dashboards under Azure Monitor or Azure Managed Prometheus.
Look for the dashboards under Azure Monitor > Insights > Containers > Networking. There are two options depending on the tier you chose for your ContainerNetworkLogs table in Log Analytics:
| Dashboard | Path | Table tier | Grafana ID |
|---|---|---|---|
| Flow Logs - Basic Tier | Azure > Insights > Containers > Networking > Flow Logs - Basic Tier | Basic | 23155 |
| Flow Logs - Analytics Tier | Azure > Insights > Containers > Networking > Flow Logs - Analytics Tier | Analytics (default) | 23156 |
Both dashboards show which AKS workloads communicate with each other, including requests, responses, drops, and errors. Use the one that matches the tier configured for your ContainerNetworkLogs table.

For more about the dashboard components, see the container network logs overview.
Tip
The ContainerNetworkLogs table defaults to the Analytics tier. If you want to reduce ingestion and retention costs, you can switch to the Basic tier and use the corresponding dashboard. For more information, see Log Analytics table plans.
Configure on-demand logs mode
On-demand logs let you capture flow data in real time without persistent storage. This mode works with both Cilium and non-Cilium data planes.
Your cluster needs Advanced Container Networking Services enabled. If you don't have an ACNS-enabled cluster yet, create one:
export CLUSTER_NAME="<aks-cluster-name>"
export RESOURCE_GROUP="<aks-resource-group>"

az aks create \
    --name $CLUSTER_NAME \
    --resource-group $RESOURCE_GROUP \
    --generate-ssh-keys \
    --location eastus \
    --max-pods 250 \
    --network-plugin azure \
    --network-plugin-mode overlay \
    --network-dataplane cilium \
    --node-count 2 \
    --pod-cidr 192.168.0.0/16 \
    --kubernetes-version 1.33 \
    --enable-acns
Enable ACNS on an existing cluster
To enable ACNS on a cluster you already have:
az aks update \
    --resource-group $RESOURCE_GROUP \
    --name $CLUSTER_NAME \
    --enable-acns
Note
Container Network Security features require the Cilium data plane.
Get your cluster credentials:
az aks get-credentials --name $CLUSTER_NAME --resource-group $RESOURCE_GROUP
Install the Hubble CLI
export HUBBLE_VERSION=v1.16.3
export HUBBLE_ARCH=amd64

if [ "$(uname -m)" = "aarch64" ]; then HUBBLE_ARCH=arm64; fi
curl -L --fail --remote-name-all https://github.com/cilium/hubble/releases/download/$HUBBLE_VERSION/hubble-linux-${HUBBLE_ARCH}.tar.gz{,.sha256sum}
sha256sum --check hubble-linux-${HUBBLE_ARCH}.tar.gz.sha256sum
sudo tar xzvfC hubble-linux-${HUBBLE_ARCH}.tar.gz /usr/local/bin
rm hubble-linux-${HUBBLE_ARCH}.tar.gz{,.sha256sum}
Use the Hubble CLI
Confirm the Hubble Relay pod is running:
kubectl get pods -o wide -n kube-system -l k8s-app=hubble-relayExpected output:
hubble-relay-7ddd887cdb-h6khj 1/1 Running 0 23hPort-forward the Hubble Relay:
kubectl port-forward -n kube-system svc/hubble-relay --address 127.0.0.1 4245:443Configure mTLS certificates for the Hubble client:
#!/usr/bin/env bash
set -euo pipefail
set -x

CERT_DIR="$(pwd)/.certs"
mkdir -p "$CERT_DIR"

declare -A CERT_FILES=(
  ["tls.crt"]="tls-client-cert-file"
  ["tls.key"]="tls-client-key-file"
  ["ca.crt"]="tls-ca-cert-files"
)

for FILE in "${!CERT_FILES[@]}"; do
  KEY="${CERT_FILES[$FILE]}"
  JSONPATH="{.data['${FILE//./\\.}']}"

  kubectl get secret hubble-relay-client-certs -n kube-system \
    -o jsonpath="${JSONPATH}" | \
    base64 -d > "$CERT_DIR/$FILE"

  hubble config set "$KEY" "$CERT_DIR/$FILE"
done

hubble config set tls true
hubble config set tls-server-name instance.hubble-relay.cilium.io
Verify the secrets exist:
kubectl get secrets -n kube-system | grep hubble-Expected output:
kube-system     hubble-relay-client-certs     kubernetes.io/tls     3     9d
kube-system     hubble-relay-server-certs     kubernetes.io/tls     3     9d
kube-system     hubble-server-certs           kubernetes.io/tls     3     9d
Observe flows from a specific pod:
hubble observe --pod hubble-relay-7ddd887cdb-h6khj
Set up the Hubble UI
Save the following manifest as
hubble-ui.yaml:apiVersion: v1 kind: ServiceAccount metadata: name: hubble-ui namespace: kube-system --- kind: ClusterRole apiVersion: rbac.authorization.k8s.io/v1 metadata: name: hubble-ui labels: app.kubernetes.io/part-of: retina rules: - apiGroups: - networking.k8s.io resources: - networkpolicies verbs: - get - list - watch - apiGroups: - "" resources: - componentstatuses - endpoints - namespaces - nodes - pods - services verbs: - get - list - watch - apiGroups: - apiextensions.k8s.io resources: - customresourcedefinitions verbs: - get - list - watch - apiGroups: - cilium.io resources: - "*" verbs: - get - list - watch --- apiVersion: rbac.authorization.k8s.io/v1 kind: ClusterRoleBinding metadata: name: hubble-ui labels: app.kubernetes.io/part-of: retina roleRef: apiGroup: rbac.authorization.k8s.io kind: ClusterRole name: hubble-ui subjects: - kind: ServiceAccount name: hubble-ui namespace: kube-system --- apiVersion: v1 kind: ConfigMap metadata: name: hubble-ui-nginx namespace: kube-system data: nginx.conf: | server { listen 8081; server_name localhost; root /app; index index.html; client_max_body_size 1G; location / { proxy_set_header Host $host; proxy_set_header X-Real-IP $remote_addr; # CORS add_header Access-Control-Allow-Methods "GET, POST, PUT, HEAD, DELETE, OPTIONS"; add_header Access-Control-Allow-Origin *; add_header Access-Control-Max-Age 1728000; add_header Access-Control-Expose-Headers content-length,grpc-status,grpc-message; add_header Access-Control-Allow-Headers range,keep-alive,user-agent,cache-control,content-type,content-transfer-encoding,x-accept-content-transfer-encoding,x-accept-response-streaming,x-user-agent,x-grpc-web,grpc-timeout; if ($request_method = OPTIONS) { return 204; } # /CORS location /api { proxy_http_version 1.1; proxy_pass_request_headers on; proxy_hide_header Access-Control-Allow-Origin; proxy_pass http://127.0.0.1:8090; } location / { try_files $uri $uri/ /index.html /index.html; } # Liveness probe location /healthz { access_log off; add_header Content-Type text/plain; return 200 'ok'; } } } --- kind: Deployment apiVersion: apps/v1 metadata: name: hubble-ui namespace: kube-system labels: k8s-app: hubble-ui app.kubernetes.io/name: hubble-ui app.kubernetes.io/part-of: retina spec: replicas: 1 selector: matchLabels: k8s-app: hubble-ui template: metadata: labels: k8s-app: hubble-ui app.kubernetes.io/name: hubble-ui app.kubernetes.io/part-of: retina spec: serviceAccountName: hubble-ui automountServiceAccountToken: true containers: - name: frontend image: mcr.microsoft.com/oss/cilium/hubble-ui:v0.12.2 imagePullPolicy: Always ports: - name: http containerPort: 8081 livenessProbe: httpGet: path: /healthz port: 8081 readinessProbe: httpGet: path: / port: 8081 resources: {} volumeMounts: - name: hubble-ui-nginx-conf mountPath: /etc/nginx/conf.d/default.conf subPath: nginx.conf - name: tmp-dir mountPath: /tmp terminationMessagePolicy: FallbackToLogsOnError securityContext: {} - name: backend image: mcr.microsoft.com/oss/cilium/hubble-ui-backend:v0.12.2 imagePullPolicy: Always env: - name: EVENTS_SERVER_PORT value: "8090" - name: FLOWS_API_ADDR value: "hubble-relay:443" - name: TLS_TO_RELAY_ENABLED value: "true" - name: TLS_RELAY_SERVER_NAME value: ui.hubble-relay.cilium.io - name: TLS_RELAY_CA_CERT_FILES value: /var/lib/hubble-ui/certs/hubble-relay-ca.crt - name: TLS_RELAY_CLIENT_CERT_FILE value: /var/lib/hubble-ui/certs/client.crt - name: TLS_RELAY_CLIENT_KEY_FILE value: /var/lib/hubble-ui/certs/client.key livenessProbe: httpGet: path: /healthz port: 8090 readinessProbe: httpGet: path: /healthz port: 8090 ports: - name: grpc containerPort: 8090 resources: {} volumeMounts: - name: hubble-ui-client-certs mountPath: /var/lib/hubble-ui/certs readOnly: true terminationMessagePolicy: FallbackToLogsOnError securityContext: {} nodeSelector: kubernetes.io/os: linux volumes: - configMap: defaultMode: 420 name: hubble-ui-nginx name: hubble-ui-nginx-conf - emptyDir: {} name: tmp-dir - name: hubble-ui-client-certs projected: defaultMode: 0400 sources: - secret: name: hubble-relay-client-certs items: - key: tls.crt path: client.crt - key: tls.key path: client.key - key: ca.crt path: hubble-relay-ca.crt --- kind: Service apiVersion: v1 metadata: name: hubble-ui namespace: kube-system labels: k8s-app: hubble-ui app.kubernetes.io/name: hubble-ui app.kubernetes.io/part-of: retina spec: type: ClusterIP selector: k8s-app: hubble-ui ports: - name: http port: 80 targetPort: 8081Apply the manifest:
kubectl apply -f hubble-ui.yamlSet up port forwarding:
kubectl -n kube-system port-forward svc/hubble-ui 12000:80Open
http://localhost:12000/in your browser to access the Hubble UI.
Troubleshooting
ACNS not enabled. Running
--enable-container-network-logswithout ACNS produces:`Flow logs requires '--enable-acns', advanced networking to be enabled.
Kubernetes version too old. Running
--enable-container-network-logson a cluster older than 1.33.0 produces:The specified orchestrator version %s is not valid. Advanced Networking Flow Logs is only supported on Kubernetes version 1.33.0 or later.CRD not recognized. Applying a
ContainerNetworkLogon a cluster without ACNS produces:error: resource mapping not found for <....>": no matches for kind "ContainerNetworkLog" in version "acn.azure.com/v1alpha1"Make sure ACNS is enabled on the cluster.
Disable stored logs mode
Stored logs has two layers — log generation on the node, and optional forwarding to Azure Monitor. You can turn off either layer independently.
Stop generating logs
Log generation is driven by ContainerNetworkLog custom resources. Deleting all of them stops new flow records from being written to /var/log/acns/hubble/events.log on each node.
kubectl delete containernetworklog --all
To remove a specific resource instead of all of them, run kubectl delete containernetworklog <cr-name>.
Stop forwarding logs to Azure Monitor
If you only want to stop sending logs to your Log Analytics workspace but keep generating them on the node, disable the Azure Monitor integration:
az aks update -n $CLUSTER_NAME -g $RESOURCE_GROUP --disable-container-network-logs
Existing ContainerNetworkLog resources remain in effect, so flows continue to land on each node at /var/log/acns/hubble/events.log until you remove those resources.
Clean up resources
If you no longer need the resources, delete the resource group:
az group delete --name $RESOURCE_GROUP
Limitations
Data plane and Kubernetes version
- Stored logs mode requires the Cilium data plane and Kubernetes 1.33 or later.
- On-demand logs (Hubble CLI and Hubble UI) work with both Cilium and non-Cilium data planes.
Layer 7 and DNS visibility
- Layer 7 flow records are populated only when L7 policy support is enabled on the cluster and a
CiliumNetworkPolicywith L7 rules covers the traffic. For details, see Configure a Layer 7 policy. - DNS records are populated only when a Cilium FQDN policy (
rules.dnsplustoFQDNs) covers the traffic.
Host-local storage
- Without Azure Monitor or an external collector, flow logs are stored on each node at
/var/log/acns/hubble/events.logand capped at 50 MB. When the cap is reached, older entries are overwritten. - Flow logs are written to host nodes and collected by the Azure Monitor Agent. If you enable Log Analytics integration after applying a
ContainerNetworkLogCRD, only new logs from that point forward are ingested. Historical logs on the host aren't collected.
Log Analytics
- Switching the Log Analytics workspace after enabling Container Network Logs may cause logs to stop flowing to the new workspace. This happens because the existing Azure Monitor data collection configuration is not automatically updated. To prevent this issue, configure the desired workspace when first enabling Container Network Logs, or manually update the associated data collection rule when changing workspaces. See Configure data collection in Container insights.
- The
ContainerNetworkLogstable supports the Analytics (default) and Basic tiers. The Auxiliary tier isn't supported.
Aggregation trade-offs
- Flow log aggregation doesn't preserve individual flow timestamps, per-pod IP addresses, or high-cardinality fields like HTTP URLs and DNS query names. Use on-demand logs for per-flow investigation.
Related content
- What are container network logs?
- Advanced Container Networking Services for AKS
- Container Network Observability in Advanced Container Networking Services