Message trace in the new Exchange admin center in Exchange Online
Message trace in the new Exchange admin center (EAC) follows email messages as they travel through your Microsoft 365 organization. You can determine if the service received, rejected, deferred, or delivered a message. Message trace also shows what actions were taken on the message before it reached its final status.
Message trace in the new EAC improves upon the original message trace that was available in the classic EAC. You can use the information from message trace to efficiently answer user questions about what happened to messages, to troubleshoot mail flow issues, and to validate policy changes.
What do you need to know before you begin?
You need to be assigned permissions before you can do the procedures in this article. You have the following options:
- Exchange Online permissions: Membership in the Organization Management role group.
- Microsoft Entra permissions: Membership in the Global Administrator or Exchange Administrator roles gives users the required permissions and permissions for other features in Microsoft 365.
The maximum number of messages that are displayed in the results depends on the report type you selected. For more information, see the Message trace results. The Get-HistoricalSearch cmdlet in Exchange Online PowerShell returns all messages in the results.
Open message trace
In the new EAC at https://admin.exchange.microsoft.com, go to Mail flow > Message trace. Or, to go directly to the Message trace page, use https://admin.exchange.microsoft.com/#/messagetrace.
Message trace page
On the Message trace page, you can start a new default trace by selecting ![]() Start a trace.
Start a trace.
In the New message trace flyout that opens, the default selections search for all messages for all senders and recipients for the last two days. Or, you can use one of the stored queries from the available tabs (as-is or as a starting points for your own queries):
- Default queries: Built-in queries provided by Microsoft 365.
- Custom queries: Queries saved by admins in your organization for future use.
- Autosaved queries: The last 10 most recently run queries. This list makes it simple to pick up from where you left off.
The Downloadable reports tab shows the downloadable report requests and the reports themselves when they're available for download.

Options for a new message trace
The following sections describe the available settings in the New message trace flyout that opens when you select ![]() Start a trace or open an existing trace.
Start a trace or open an existing trace.

Senders and Recipients
The default value for Senders and Recipients is All, but you can enter specific values:
- Senders: Click in the box and start typing to enter or select one or more senders from your organization.
- Recipients: Click in the box and start typing to enter or select one or more recipients in your organization.
You can type the email addresses of external senders and recipients. Wildcards are supported (for example, *@contoso.com), but you can't use multiple wildcards in one value.
You can paste multiple sender or recipient lists separated by semicolons (;), spaces (\s), carriage returns (\r), or new lines (\n).
Time range
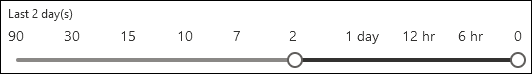
In the Time range section, the default value is 2 days, but you can specify date/time ranges up to 90 days. When you use date/time ranges, consider the following issues:
By default, you select the time range in Slider view using a timeline.
Saving a query in Slider view saves the relative time range (for example, two days from today).
You can switch to Custom time range view to specify the following values:
- Time zone: Applies to your query inputs and query results.
- Start date: Date and time.
- End date: Date and time.

Saving a query in Custom time range view saves the absolute date/time range (for example,
2023-05-06 13:00 to 2023-05-08 18:00).


For 10 days or less, the results are available instantly as a Summary report.
If you specify a date/time range that's even slightly greater than 10 days:
- The results are available only as a downloadable CSV file (an Enhanced summary report or an Extended report).
- The results are prepared using archived message trace data. It might take several hours before the report is available to download. Depending on how many other admins have also submitted report requests around the same time, you might also notice a delay before processing starts on a queued request.
Detailed search options
In the Detailed search options section, the following options are available:
Delivery status: The following values are available:
- All: This is the default value.
- Delivered: The message was successfully delivered to the intended destination.
- Expanded: A distribution group recipient was expanded before delivery to the individual members of the group.
- Failed: The message wasn't delivered.
- Pending*: Delivery of the message is being attempted or reattempted.
- Quarantined*: The message was quarantined (as spam, bulk mail, or phishing). For more information, see Quarantined email messages in EOP.
- Filtered as spam*: The message was identified as spam, and was rejected or blocked (not quarantined).
- Getting status: The message was recently received by Microsoft 365, but no other status data is yet available. You can check again within a few minutes.
* This value is available only in searches that are less than 10 days. If you need to query data that's older than 10 days, use the Start-HistoricalSearch cmdlet in Exchange Online PowerShell.
Note
there might be a five to ten minute delay between the reported and actual and reported delivery status values.
Message ID: The internet message ID (also known as the Client ID) that's found in the Message-ID header field in the message header. Users can give you this value to investigate specific messages.
This value is constant for the lifetime of the message. For messages created in Microsoft 365 or Exchange, the Message ID value uses the format
<GUID@ServerFQDN>, including the angled brackets. For example,<d9683b4c-127b-413a-ae2e-fa7dfb32c69d@DM3NAM06BG401.Eop-nam06.prod.protection.outlook.com>. Other email systems might use different syntax or values. This value is supposed to be unique, but not all email systems strictly follow this requirement. If the Message-ID: header field doesn't exist or is blank for incoming messages from external sources, an arbitrary value is assigned.When you use Message ID to filter the results, ensure that you include the full string, including any angled brackets.
Direction: Select one of the following values:
- All: This is the default value.
- Inbound: Messages sent to recipients in your organization.
- Outbound: Messages sent from users in your organization.
Original client IP address: The IP address of the email sender's client computer or device. You can use this filter to investigate hacked computers that are sending large amounts of spam or malware. Although the messages might appear to come from multiple senders, it's likely that the same computer is generating all of the messages.
Note
Client IP address information is available only for 10 days and only in the Enhanced summary report or the Extended report (downloadable CSV files).
Report type
The available report types are:
Summary report: Available if the time range is less than 10 days, and requires no other filtering options. The results are available almost immediately after you select Search. The report returns up to 20,000 results.
Select Search to start the message trace. You're taken to the Message trace search results page as described in the Summary report output section.
The last 10 Summary report queries are available on the Autosaved queries tab on the Message trace page.
Enhanced summary report: Includes the information in the summary report plus other details (for example, direction and original client IP address). Available only as a downloadable CSV file. The report returns up to 100,000 results.
Extended report: Includes the same information as the extended summary report plus comprehensive routing and message event details. Available only as a downloadable CSV file. The report returns up to 1,000 results.
The Enhanced summary report and the Extended report require one or more of the following filtering options, regardless of the time range: Senders, Recipients, or Message ID.
The Enhanced summary report and the Extended report are prepared using archived message trace data. It might take several hours before the report is available to download. Depending on how many other admins have also submitted report requests around the same time, you might also notice a delay before processing starts on a queued request.
While you can select the Enhanced summary report or Extended report for any date/time range, the last 24 hours of archived data isn't typically available.
The maximum size for a downloadable CSV file is 800 MB. If a downloadable report exceeds 800 MB, you can't open the report in Excel or Notepad.
When you select Next, you're taken to a summary flyout that lists the selected filtering options, a unique (editable) title for the report, and the email address to receive the notification when the message trace completes (also editable, and must be in one of the accepted domains of your organization).
Select Prepare report to submit the message trace. You can see the status of the report on the Downloadable reports tab. For more information about the data that's returned, see the Enhanced summary reports and Extended reports sections.
Message trace results
The different report types return different levels of information. The information that's available in the different reports is described in the following sections:
Summary report output
After you run the message trace, the results are sorted by descending date/time (most recent events first).
The Summary report contains the following information:
- Date: The date and time at which the message was received by the service, using the configured UTC time zone.
- Sender: The email address of the sender (alias@domain).
- Recipient: The email address of the recipient. If the message has multiple recipients, each recipient is on a separate line. If the recipient is a distribution group, dynamic distribution group, or mail-enabled security group, the group is the first recipient, followed by each group member on a separate line.
- Subject: The first 256 characters of the message's Subject: field.
- Status: These values are described in the Detailed search options section.
By default, the first 250 results are loaded and readily available. When you scroll down, there's a slight pause as the next batch of results are loaded, up to a maximum of 10,000.
You can sort the entries by clicking on an available column header.
On the Email tab, you can decrease the vertical spacing in the list by clicking ![]() Change view and then selecting
Change view and then selecting ![]() Compact list.
Compact list.
Use the ![]() Search box and a corresponding value to find specific entries. Wildcards aren't supported
Search box and a corresponding value to find specific entries. Wildcards aren't supported
For more advanced filters that you can also save and use later, select ![]() Filter , and then select
Filter , and then select ![]() New filter. In the Custom filter flyout that opens, enter the following information:
New filter. In the Custom filter flyout that opens, enter the following information:
Name your filter: Enter a unique name.
Add a filter clause by entering the following information:
- Field: Select from the following values:
- Sender
- Recipient
- Subject
- Status
- Operator: Select starts with or is.
- Value: Enter the value you want to search for.
You can select Add new clause and repeat the previous step as many times as needed. Multiple clauses use AND logic (<Clause1> AND <Clause2>...).
To remove a filter clause, select
 Remove clause next to the entry.
When you're finished in the Custom filter flyout, select Save. The new filter is automatically loaded, and the filtered results are shown on the Message trace search results page. This result is the same as selecting
 Filter and then selecting the existing filter from the Custom filters section in the list.
To unload an existing filter and return to the default information that's shown on the Message trace search results page, select
 >
>  Clear all filters.
- Field: Select from the following values:
Select  Edit message trace to edit the search criteria.
Use ![]() Export results to export the displayed results to a CSV file.
Export results to export the displayed results to a CSV file.
Select  Refresh to refresh the results.
Find related records for this message
Related message records are records that share the same Message ID. Remember, even a single message sent between two people can generate multiple records. The number of records increases when the message is affected by distribution group expansion, forwarding, mail flow rules (also known as transport rules), and so on.
In the blank area next to the Date column, select the round check box that appears next to the entry. The following actions appear on the Message traces results page:
 View in Explorer: Opens the message in Threat Explorer in organizations with Microsoft Defender for Office 365 Plan 2. For more information, see What is Threat Explorer?.
 Go Hunting: Looks for the message in Threat Explorer in organizations with Microsoft Defender for Office 365 Plan 2. For more information, see Threat hunting in Threat Explorer for Microsoft Defender for Office 365
-
Find related: Opens a new message trace to find the related records for the message.
For more information about the Message ID, see the Detailed search options section.
Message trace details
In the summary report output, you can view details about a message by clicking anywhere in the row other than the round check box that appears next to the Date value.

The details flout that opens contains the following information that's not present in the summary report:
Message events: After you expand this section, you can see classifications that help categorize the actions that the service takes on messages. Some of the more interesting events that you might encounter are:
- Receive: The message was received by the service.
- Send: The message was sent by the service.
- Fail: The message failed to be delivered.
- Deliver: The message was delivered to a mailbox.
- Expand: The message was sent to a distribution group that was expanded.
- Transfer: Recipients were moved to a bifurcated message because of content conversion, message recipient limits, or agents.
- Defer: The message delivery was postponed and might be reattempted later.
- Resolved: The message was redirected to a new recipient address based on an Active Directory look up. When this event happens, the original recipient address is listed in a separate row in the message trace along with the final delivery status for the message.
- DLP rule: The message had a DLP rule match.
- Sensitivity label: A server-side labeling event occurred. For example, a label was automatically added to a message that includes an action to encrypt or was added via the web or mobile client. This action is completed by the Exchange server and is logged. A label added via Outlook isn't included in the event field.
Notes:
- An uneventful message that's successfully delivered generates multiple Event entries in the message trace. For descriptions of more events, see Event types in the message tracking log. This link is an Exchange Server (on-premises Exchange) topic.
More information: After you expand this section, you can view the following details:
- Message ID: This value is described in the Detailed search options section. An example of a Message ID value is
<d9683b4c-127b-413a-ae2e-fa7dfb32c69d@DM3NAM06BG401.Eop-nam06.prod.protection.outlook.com>. - Message size: The size of the sent message, including attachments/pictures/text.
- From IP: The IP address of the computer that sent the message. For outbound messages sent from Exchange Online, this value is blank.
- To IP: The IP address(es) to which the service attempted to deliver the message. If the message has multiple recipients, these addresses are displayed. For inbound messages sent to Exchange Online, this value is blank.
- Message ID: This value is described in the Detailed search options section. An example of a Message ID value is
Enhanced summary reports
An Enhanced summary report is available on the Downloadable reports tab on the Message trace page:
- Reports that are available to download have the Status value Complete
- Reports that aren't available to download have the Status values Not started or In progress.
The following information is available in the Enhanced summary report CSV file:
- origin_timestamp*: The date and time when the message was initially received by the service, using the configured UTC time zone.
- sender_address: The sender's email address (alias@domain).
- Recipient_status: The status of the delivery of the message to the recipient. If the message was sent to multiple recipients, it shows all the recipients and the corresponding status for each, in the format: <email address>##<status>. Examples of the recipient statuses are:
- ##Receive, Send means the message was received by the service and was sent to the intended destination.
- ##Receive, Fail means the message was received by the service but delivery to the intended destination failed.
- ##Receive, Deliver means the message was received by the service and was delivered to the recipient's mailbox.
- message_subject: The first 256 characters of the message's Subject field.
- total_bytes: The size of the message in bytes, including attachments.
- message_id: This value is described in the Detailed search options section. An example of a message_id value is
<d9683b4c-127b-413a-ae2e-fa7dfb32c69d@DM3NAM06BG401.Eop-nam06.prod.protection.outlook.com>. - network_message_id: A unique message ID value that persists across all copies of the message that might be created due to bifurcation or distribution group expansion. An example of network_message_id value is
1341ac7b13fb42ab4d4408cf7f55890f. - original_client_ip: The IP address of the sender's SMTP server.
- directionality: Indicates whether the message was sent inbound (to your organization) or outbound (from your organization).
- connector_id: The name of the source or destination connector. For more information about connectors in Exchange Online, see Configure mail flow using connectors in Office 365.
- delivery_priority*: Whether the message was sent with High, Low, or Normal priority.
* These properties are available only in an Enhanced summary report.
Extended reports
An Extended report is available on the Downloadable reports tab on the Message trace page:
- Reports that are available to download have the Status value Complete
- Reports that aren't available to download have the Status values Not started or In progress.
The following information is available in the Enhanced report CSV file:
client_ip: The IP address of the email server or messaging client that submitted the message.
client_hostname: The host name or FQDN of the email server or messaging client that submitted the message.
server_ip: The IP address of the source or destination server.
server_hostname: The host name or FQDN of the destination server.
source_context: Extra information associated with the source field. For example:
Protocol Filter Agent3489061114359050000
source: The Exchange Online component that's responsible for the event. For example:
AGENTMAILBOXRULESMTP
event_id: This value corresponds to the Message event values that are explained in Find related records for this message.
internal_message_id: A message identifier assigned by the Exchange Online server that's currently processing the message.
recipient_address: The email addresses of the message's recipients. Multiple email addresses are separated by the semicolon character (;).
recipient_count: The total number of recipients in the message.
related_recipient_address: Present with
EXPAND,REDIRECT, andRESOLVEevents to display other recipients' email addresses that are associated with the message.reference: This field contains additional information for specific types of events. For example:
DSN: Contains the report link, which is the message_id value of the associated delivery status notification (also known as a DSN, nondelivery report, NDR, or bounce message) if a DSN is generated subsequent to this event. If this message is a DSN message, this field contains the message_id value of the original message that the DSN was generated for.
EXPAND: Contains the related_recipient_address value of the related messages.
RECEIVE: Might contain the message_id value of the related message if the message was generated by other processes (for example, Inbox rules).
SEND: Contains the internal_message_id value of any DSN message.
TRANSFER: Contains the internal_message_id value of the message that's being forked (for example, by content conversion, message recipient limits, or agents).
MAILBOXRULE: Contains the internal_message_id value of the inbound message that caused the Inbox rule to generate the outbound message.
For other types of events, this field (internal_message_id) is blank.
return_path: The return email address specified by the MAIL FROM command that sent the message. Although this field is never empty, it can have the null sender address value represented as
<>.message_info: Additional information about the message. For example:
- The message origination date-time in UTC for
DELIVERandSENDevents. The origination date-time is the time when the message first entered the Exchange Online organization. The UTC date-time is represented in the ISO 8601 date-time format:yyyy-mm-ddThh:mm:ss.fffZ, whereyyyy= year,mm= month,dd= day,Tindicates the beginning of the time component,hh= hour,mm= minute,ss= second,fff= fractions of a second, andZsignifiesZulu, which is another way to denote UTC. - Authentication errors. For example, you might see the value
11aand the type of authentication that was used when the authentication error occurred.
- The message origination date-time in UTC for
tenant_id: A GUID value that represents the Exchange Online organization (for example,
39238e87-b5ab-4ef6-a559-af54c6b07b42).original_server_ip: The IP address of the original server.
custom_data: Contains data related to specific event types. For more information, see the following sections:
custom_data values
The custom_data field for an AGENTINFO event is used by various Exchange Online agents to log message-processing details. Some of the more interesting agents are described in the following sections.
Spam filter agent
A custom_data value that starts with S:SFA is from the spam filter agent. For more information, see X-Forefront-Antispam-Report message header fields.
An example of a custom_data value for a message that's filtered for spam looks like this:
S:SFA=SUM|SFV=SPM|IPV=CAL|SRV=BULK|SFS=470454002|SFS=349001|SCL=9|SCORE=-1|LIST=0|DI=SN|RD=ftmail.inc.com|H=ftmail.inc.com|CIP=98.129.140.74|SFP=1501|ASF=1|CTRY=US|CLTCTRY=|LANG=en|LAT=287|LAT=260|LAT=18;
Malware filter agent
A custom_data value that starts with S:AMA is from the malware filter agent. The key details are described in the following table:
| Value | Description |
|---|---|
AMA=SUM|v=1| or AMA=EV|v=1 |
The message was determined to contain malware. SUM indicates the malware could have been detected by any number of engines. EV indicates the malware was detected by a specific engine. When an engine detects malware, the subsequent actions are triggered. |
Action=r |
The message was replaced. |
Action=p |
The message was bypassed. |
Action=d |
The message was deferred. |
Action=s |
The message was deleted. |
Action=st |
The message was bypassed. |
Action=sy |
The message was bypassed. |
Action=ni |
The message was rejected. |
Action=ne |
The message was rejected. |
Action=b |
The message was blocked. |
Name=<malware> |
The name of the malware that was detected. |
File=<filename> |
The name of the file that contained the malware. |
An example of a custom_data value for a message that contains malware looks like this:
S:AMA=SUM|v=1|action=b|error=|atch=1;S:AMA=EV|engine=M|v=1|sig=1.155.974.0|name=DOS/Test_File|file=filename;S:AMA=EV|engine=A|v=1|sig=201707282038|name=Test_File|file=filename
Transport Rule agent
A custom_data value that starts withS:TRA is from the Transport Rule agent for mail flow rules (also known as transport rules). The key details are described in the following table:
| Value | Description |
|---|---|
ETR|ruleId=<guid> |
The rule ID that was matched. |
St=<datetime> |
The date and time in UTC when the rule match occurred. |
Action=<ActionDefinition> |
The action that was applied. For a list of available actions, see Mail flow rule actions in Exchange Online. |
Mode=<Mode> |
The mode of the rule. Valid values are:
|
An example of a custom_data value for a message that matches the conditions of a mail flow rule looks like this:
S:TRA=ETR|ruleId=19a25eb2-3e43-4896-ad9e-47b6c359779d|st=7/17/2017 12:31:25 AM|action=ApplyHtmlDisclaimer|sev=1|mode=Enforce