Note
Access to this page requires authorization. You can try signing in or changing directories.
Access to this page requires authorization. You can try changing directories.
Eventhouse monitoring in Fabric offers comprehensive insights into the usage and performance of your eventhouse by collecting end-to-end metrics and logs for all aspects of an Eventhouse. It's part of workspace monitoring that allows you to monitor Fabric items in your workspace. Eventhouse monitoring provides a set of tables that you can query to get insights into the usage and performance of your eventhouse. Use these queries to optimize your eventhouse and improve the user experience.
Prerequisites
- A workspace with a Microsoft Fabric-enabled capacity
- An eventhouse in your workspace.
Enable Eventhouse monitoring
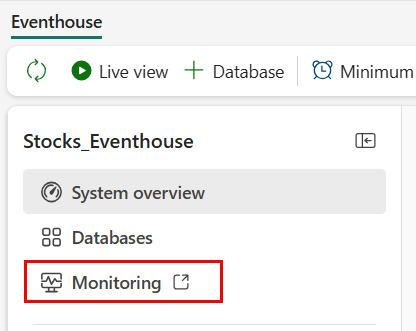
From the Eventhouse explorer pane, select Monitoring.
You can also access the monitoring eventhouse from the workspace where your eventhouse is located. From the workspace where your eventhouse is located, select Workspace Settings and select the Monitoring tab.
Select + Eventhouse and wait for the success message confirming that the monitoring eventhouse was added to your workspace.
Workspace activity logging is automatically enabled.
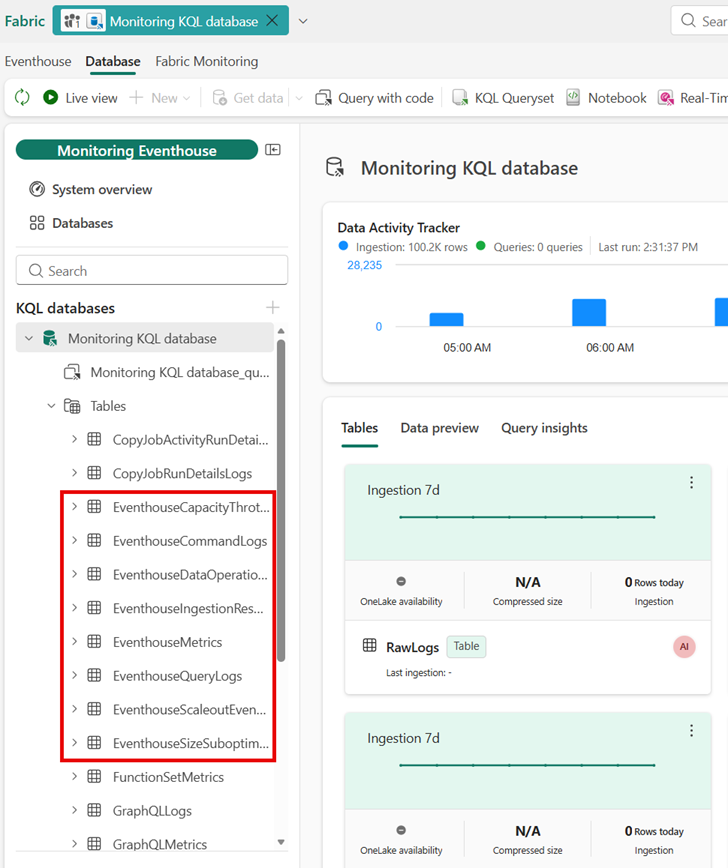
Select the Monitoring database link to open the Monitoring Eventhouse in a new tab.
In the Monitoring KQL database overview page, view the query insights and query the data.
Tip
You can also analyze data with an SQL analytics endpoint or notebook, or create a standalone KQL queryset to analyze the monitoring data.
Eventhouse monitoring tables
When monitoring your eventhouse, you can query the following tables:
Sample queries
You can find sample queries in the workspace-monitoring folder of the fabric-samples GitHub repository.
Monitoring built-in templates
The templates let you create monitoring dashboards that track workspace activities in real-time by connecting directly to the underlying monitoring Eventhouse. In the dashboard, you can monitor semantic models, KQL database queries, and ingestions.
Follow the Visualize your Workspace Monitoring Data guide to create the templates or download the templates from the workspace-monitoring-dashboards GitHub repository or from the links in the following section.
The repository contains instructions on how to prepare the environment and how to use the templates.
Two monitoring templates are available:

