Action reports in Kaizala
Important
Microsoft Kaizala has retired on August 31, 2023. We recommend using Microsoft Teams for continued connection, sharing, and collaboration.
Surveys
To view survey reports, from the home page, go to Reports from the navigation bar. Select the Survey Report tile from the list of available reports. This report displays the following information for organization groups:
- Total number of sent surveys.
- Total number of open surveys.
- Total number of responses received for surveys.
- Group wise survey status – how many surveys are still open or active (and which users can respond) versus how many are already closed or expired.
- Count of responses for each survey.
The following filters are available in a survey report:
- Organization group – Ability to select one or more groups. By default, all permissible organization groups are listed.
- Survey status – Filter reports by survey status (open or closed).
- Survey created date – Filter reports based on when a survey was created. Select a specific date or a date range.
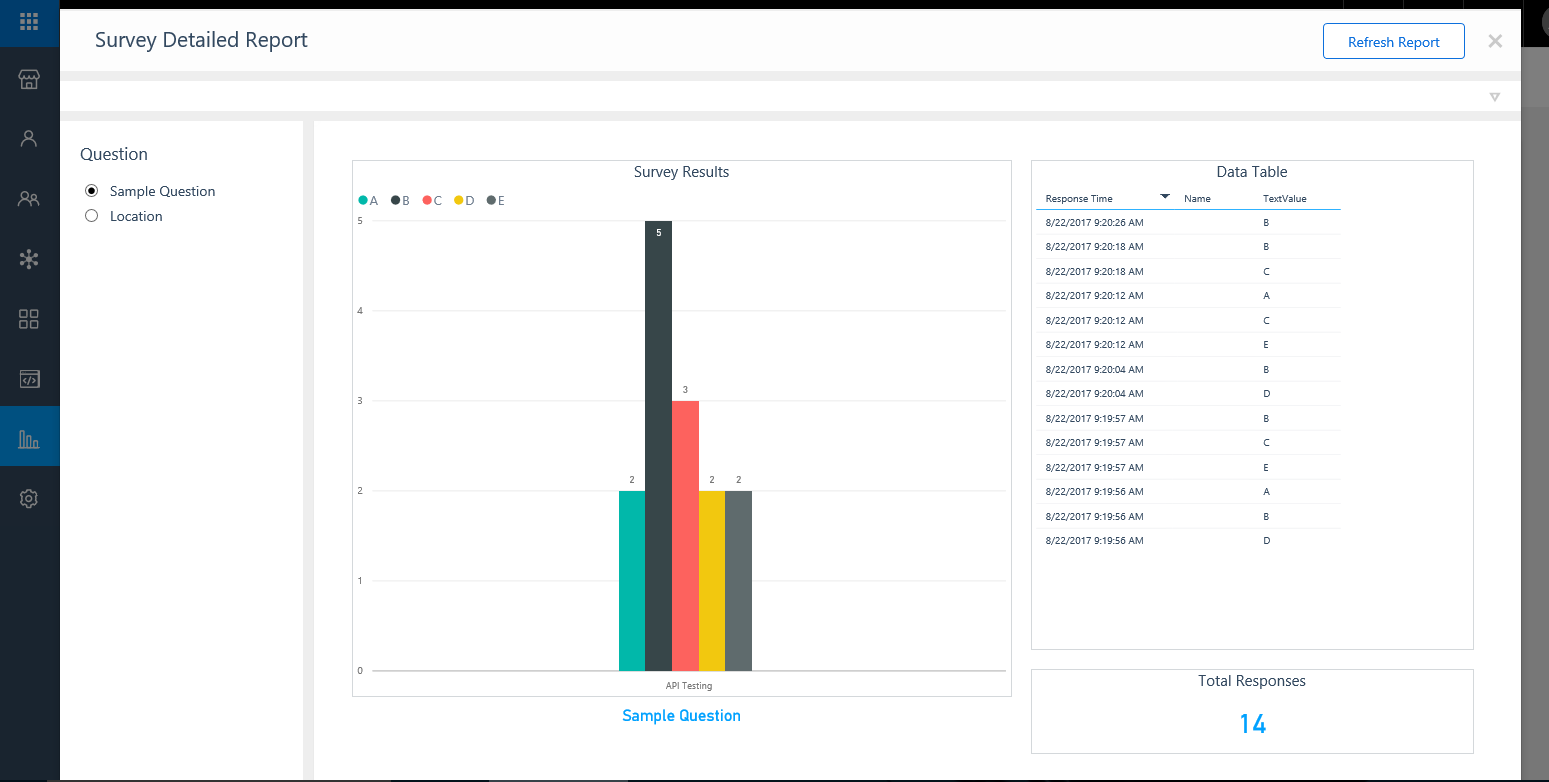
Detailed survey reports
To view a survey detailed report, from the home page, go to Reports from the navigation bar. Select the Survey Detailed Report tile. In the dialog box, choose the group and survey from the drop-down lists. The report consists of five tabs:
- Multi-choice Questions – This tab shows the summary and detailed analysis of the selected options,for multiple-choice type questions.
- Numeric Questions – This tab shows the aggregated as well as detailed responses for each numeric and question, including sum, average, and counts.
- Location – If the location is turned on for a survey, then the responses are mapped to a location.
- Text Responses – An automatically generated word cloud based on survey responses. Organizations can use surveys to get feedback from their employees and then use this report to visualize the details.
- Images – View all the photos collected via a survey in a single place.
Polls
To view a poll detailed report, from the home page, go to Reports from the navigation bar. Select the Poll Detailed Report tile. In the dialog box, choose the group and poll title from the drop-down lists. The report consists of only one tab which shows the summary and detailed analysis of choices made for that poll's question.
Jobs
To view job reports, from the home page, go to Reports from the navigation bar. Select the Job Report tile from the list of available reports and select an organization group from the drop-down list. The report consists of three tabs:
- Open Jobs – Shows the total number of pending jobs, jobs past due date, and jobs still open.
- Trends – Depicts the on-time completion trend and a weekly job trend. For each group, this report shows the number of jobs created during a week, as well as their status of completion. Jobs could be Completed, Completed - Past Due, Pending, or Pending - Past Due.
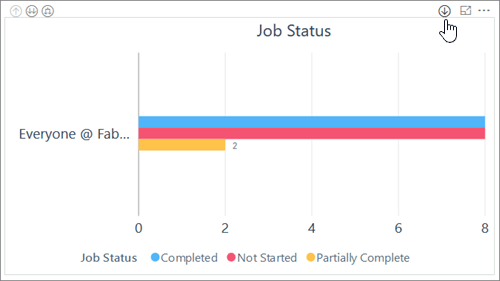
- Group wise jobs status – How many jobs are not started, partially complete, or completed for each group.
Report filters
Reports may have generic or specific filters that allow users to see reports for specific criteria. For example, users can use the group filter to see data for a specific group. Similarly, users can use the Create Date filter to see the Actions for a specific date or date range.
Report drill-down support
Some reports have drill-down support for hierarchical groups that shows aggregated data and graphs. To turn on the report drill-down mode:
Click or tap the arrow icon as shown here:
Export Kaizala report data to a CSV file
You can export your Kaizala report data to a CSV file using Power BI. To export the data, click the … on the top right corner of the graph, and choose Export.