Events
Mar 31, 11 PM - Apr 2, 11 PM
The biggest Fabric, Power BI, and SQL learning event. March 31 – April 2. Use code FABINSIDER to save $400.
Register todayThis browser is no longer supported.
Upgrade to Microsoft Edge to take advantage of the latest features, security updates, and technical support.
Applies to:  SQL Server 2019 and later Analysis Services
Azure Analysis Services
Fabric/Power BI Premium
SQL Server 2019 and later Analysis Services
Azure Analysis Services
Fabric/Power BI Premium
In this lesson, you use the Analyze in Excel feature to open Microsoft Excel, automatically create a connection to the model workspace, and automatically add a PivotTable to the worksheet. The Analyze in Excel feature is meant to provide a quick and easy way to test the efficacy of your model design prior to deploying your model. You do not perform any data analysis in this lesson. The purpose of this lesson is to familiarize you, the model author, with the tools you can use to test your model design.
To complete this lesson, Excel must be installed on the same computer as Visual Studio.
Estimated time to complete this lesson: 5 minutes
This article is part of a tabular modeling tutorial, which should be completed in order. Before performing the tasks in this lesson, you should have completed the previous lesson: Lesson 11: Create roles.
In these first tasks, you browse your model by using both the default perspective, which includes all model objects, and also by using the Internet Sales perspective you created earlier. The Internet Sales perspective excludes the Customer table object.
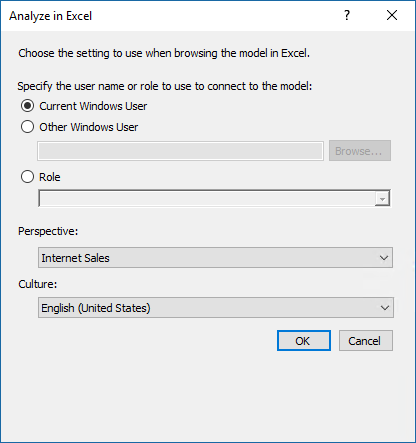
Click Extensions > Model > Analyze in Excel.
In the Analyze in Excel dialog box, click OK.
Excel opens with a new workbook. A data source connection is created using the current user account and the Default perspective is used to define viewable fields. A PivotTable is automatically added to the worksheet.
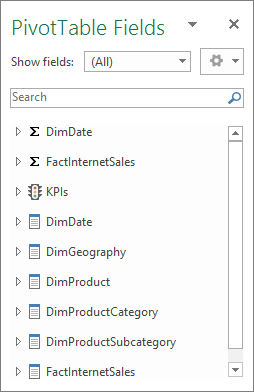
In Excel, in the PivotTable Field List, notice the DimDate and FactInternetSales measure groups appear. The DimCustomer, DimDate, DimGeography, DimProduct, DimProductCategory, DimProductSubcategory, and FactInternetSales tables with their respective columns also appear.
Close Excel without saving the workbook.
Click Extensions > Model > Analyze in Excel.
In the Analyze in Excel dialog box, leave Current Windows User selected, then in the Perspective drop-down listbox, select Internet Sales, and then click OK.
In Excel, in PivotTable Fields, notice the DimCustomer table is excluded from the field list.
Close Excel without saving the workbook.
Roles are an important part of any tabular model. Without at least one role to which users are added as members, users cannot access and analyze data using your model. The Analyze in Excel feature provides a way for you to test the roles you have defined.
Click Extensions > Model > Analyze in Excel.
In Specify the user name or role to use to connect to the model, select Role, and then in the drop-down listbox, select Sales Manager, and then click OK.
Excel opens with a new workbook. A PivotTable is automatically created. The Pivot Table Field List includes all the data fields available in your new model.
Close Excel without saving the workbook.
Go to the next lesson: Lesson 13: Deploy
Events
Mar 31, 11 PM - Apr 2, 11 PM
The biggest Fabric, Power BI, and SQL learning event. March 31 – April 2. Use code FABINSIDER to save $400.
Register todayTraining
Module
Transcend data analysis together with Power BI and Excel - Training
This module introduces potential ways that people can use Excel and Power BI together. Power BI is a great tool for telling a story through visuals; occasionally, it's beneficial to use Excel for analysis. Excel can make a connection to a Power BI dataset, enabling you to analyze the data by using PivotTables.
Certification
Microsoft Certified: Power BI Data Analyst Associate - Certifications
Demonstrate methods and best practices that align with business and technical requirements for modeling, visualizing, and analyzing data with Microsoft Power BI.