Create measures
Applies to:  SQL Server 2019 and later Analysis Services
Azure Analysis Services
Fabric/Power BI Premium
SQL Server 2019 and later Analysis Services
Azure Analysis Services
Fabric/Power BI Premium
In this lesson, you create measures to be included in your model. Similar to the calculated columns you created, a measure is a calculation created by using a DAX formula. However, unlike calculated columns, measures are evaluated based on a user selected filter. For example, a particular column or slicer added to the Row Labels field in a PivotTable. A value for each cell in the filter is then calculated by the applied measure. Measures are powerful, flexible calculations that you want to include in almost all tabular models to perform dynamic calculations on numerical data. To learn more, see Measures.
To create measures, you use the Measure Grid. By default, each table has an empty measure grid; however, you typically do not create measures for every table. The measure grid appears below a table in the model designer when in Data View. To hide or show the measure grid for a table, click the Table menu, and then click Show Measure Grid.
You can create a measure by clicking an empty cell in the measure grid, and then typing a DAX formula in the formula bar. When you click ENTER to complete the formula, the measure then appears in the cell. You can also create measures using a standard aggregation function by clicking a column, and then clicking the AutoSum button (∑) on the toolbar. Measures created using the AutoSum feature appear in the measure grid cell directly beneath the column, but can be moved.
In this lesson, you create measures by both entering a DAX formula in the formula bar, and by using the AutoSum feature.
Estimated time to complete this lesson: 30 minutes
Prerequisites
This article is part of a tabular modeling tutorial, which should be completed in order. Before performing the tasks in this lesson, you should have completed the previous lesson: Lesson 5: Create calculated columns.
Create measures
To create a DaysCurrentQuarterToDate measure in the DimDate table
In the model designer, click the DimDate table.
In the measure grid, click the top-left empty cell.
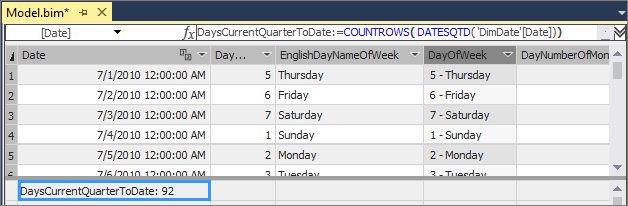
In the formula bar, type the following formula:
DaysCurrentQuarterToDate:=COUNTROWS( DATESQTD( 'DimDate'[Date]))Unlike calculated columns, with measure formulas you can type the measure name, followed by a colon, followed by the formula expression.
Notice the top-left cell now contains a measure name, DaysCurrentQuarterToDate, followed by a result. The result is not relevant at this point because no user filter has been applied.
To create a DaysInCurrentQuarter measure in the DimDate table
With the DimDate table still active in the model designer, in the measure grid, click the empty cell below the measure you created.
In the formula bar, type the following formula:
DaysInCurrentQuarter:=COUNTROWS( DATESBETWEEN( 'DimDate'[Date], STARTOFQUARTER( LASTDATE('DimDate'[Date])), ENDOFQUARTER('DimDate'[Date])))When creating a comparison ratio between one incomplete period and the previous period, the formula must calculate the proportion of the period that has elapsed and compare it to the same proportion in the previous period. In this case, [DaysCurrentQuarterToDate]/[DaysInCurrentQuarter] gives the proportion elapsed in the current period.
To create an InternetDistinctCountSalesOrder measure in the FactInternetSales table
Click the FactInternetSales table.
Click the SalesOrderNumber column heading.
On the toolbar, click the down-arrow next to the AutoSum (∑) button, and then select DistinctCount.
The AutoSum feature automatically creates a measure for the selected column using the DistinctCount standard aggregation formula.
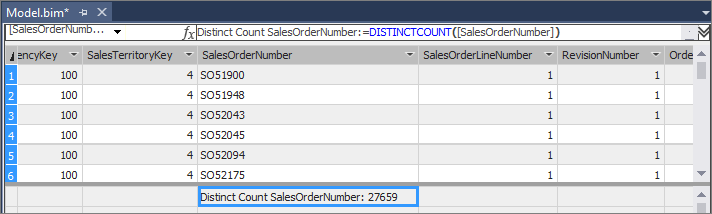
In the measure grid, click the new measure, and then in the Properties window, in Measure Name, rename the measure to InternetDistinctCountSalesOrder.
To create additional measures in the FactInternetSales table
By using the AutoSum feature, create and name the following measures:
Column Measure name AutoSum (∑) Formula SalesOrderLineNumber InternetOrderLinesCount Count =COUNTA([SalesOrderLineNumber]) OrderQuantity InternetTotalUnits Sum =SUM([OrderQuantity]) DiscountAmount InternetTotalDiscountAmount Sum =SUM([DiscountAmount]) TotalProductCost InternetTotalProductCost Sum =SUM([TotalProductCost]) SalesAmount InternetTotalSales Sum =SUM([SalesAmount]) Margin InternetTotalMargin Sum =SUM([Margin]) TaxAmt InternetTotalTaxAmt Sum =SUM([TaxAmt]) Freight InternetTotalFreight Sum =SUM([Freight]) By clicking an empty cell in the measure grid, and by using the formula bar, create, the following custom measures in order:
InternetPreviousQuarterMargin:=CALCULATE([InternetTotalMargin],PREVIOUSQUARTER('DimDate'[Date]))InternetCurrentQuarterMargin:=TOTALQTD([InternetTotalMargin],'DimDate'[Date])InternetPreviousQuarterMarginProportionToQTD:=[InternetPreviousQuarterMargin]*([DaysCurrentQuarterToDate]/[DaysInCurrentQuarter])InternetPreviousQuarterSales:=CALCULATE([InternetTotalSales],PREVIOUSQUARTER('DimDate'[Date]))InternetCurrentQuarterSales:=TOTALQTD([InternetTotalSales],'DimDate'[Date])InternetPreviousQuarterSalesProportionToQTD:=[InternetPreviousQuarterSales]*([DaysCurrentQuarterToDate]/[DaysInCurrentQuarter])
Measures created for the FactInternetSales table are used to analyze critical financial data such as sales, costs, and profit margin for items defined by the user selected filter.
Now that you've created a bunch of measure, take a look at Measures in Tabular Model Explorer. You'll see all of your new measures. Right-click a measure and you see actions you can now take on a that measure.
Next step
Feedback
Coming soon: Throughout 2024 we will be phasing out GitHub Issues as the feedback mechanism for content and replacing it with a new feedback system. For more information see: https://aka.ms/ContentUserFeedback.
Submit and view feedback for