Events
Mar 31, 11 PM - Apr 2, 11 PM
The biggest Fabric, Power BI, and SQL learning event. March 31 – April 2. Use code FABINSIDER to save $400.
Register todayThis browser is no longer supported.
Upgrade to Microsoft Edge to take advantage of the latest features, security updates, and technical support.
Applies to:  SQL Server 2019 and later Analysis Services
Azure Analysis Services
Fabric/Power BI Premium
SQL Server 2019 and later Analysis Services
Azure Analysis Services
Fabric/Power BI Premium
In this lesson, you create an Internet Sales perspective. A perspective defines a viewable subset of a model that provides focused, business-specific, or application-specific viewpoints. When a user connects to a model by using a perspective, they see only those model objects (tables, columns, measures, hierarchies, and KPIs) as fields defined in that perspective. To learn more, see Perspectives.
The Internet Sales perspective you create in this lesson excludes the DimCustomer table object. When you create a perspective that excludes certain objects from view, that object still exists in the model, however, it's not visible in a reporting client field list. Calculated columns and measures either included in a perspective or not can still calculate from object data that is excluded.
The purpose of this lesson is to describe how to create perspectives and become familiar with the tabular model authoring tools. If you later expand this model to include additional tables, you can create additional perspectives to define different viewpoints of the model, for example, Inventory and Sales.
Estimated time to complete this lesson: Five minutes
This article is part of a tabular modeling tutorial, which should be completed in order. Before performing the tasks in this lesson, you should have completed the previous lesson: Lesson 7: Create Key Performance Indicators.
Click Extensions > Model > Perspectives > Create and Manage.
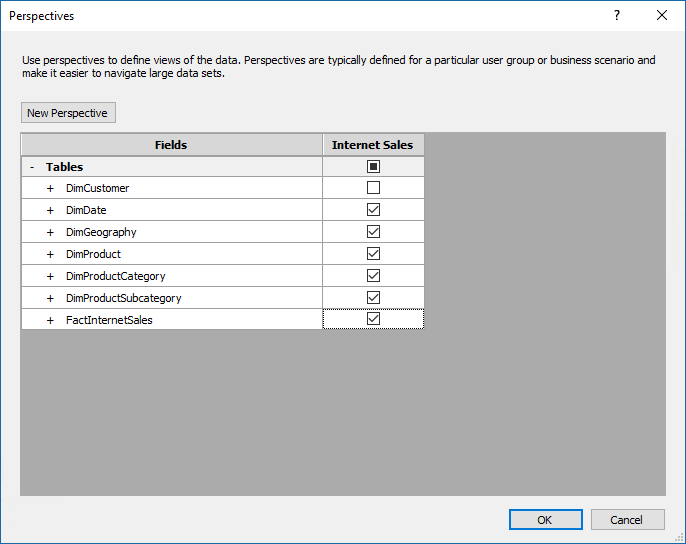
In the Perspectives dialog box, click New Perspective.
Double-click the New Perspective column heading, and then rename Internet Sales.
Select the all the tables except DimCustomer.
In a later lesson, you use the Analyze in Excel feature to test this perspective. The Excel PivotTable Fields List includes each table except the DimCustomer table.
Events
Mar 31, 11 PM - Apr 2, 11 PM
The biggest Fabric, Power BI, and SQL learning event. March 31 – April 2. Use code FABINSIDER to save $400.
Register todayTraining
Module
Add calculated tables and columns to Power BI Desktop models - Training
By the end of this module, you'll be able to add calculated tables and calculated columns to your semantic model. You'll also be able to describe row context, which is used to evaluated calculated column formulas. Because it's possible to add columns to a table by using Power Query, you'll also learn when it's best to create calculated columns instead of Power Query custom columns.
Certification
Microsoft Certified: Power BI Data Analyst Associate - Certifications
Demonstrate methods and best practices that align with business and technical requirements for modeling, visualizing, and analyzing data with Microsoft Power BI.
Documentation
Analysis Services tutorial lesson 9: Create hierarchies
Learn how to create hierarchies for an Analysis Services tabular model project.
Analysis Services tutorial lesson 7: Create Key Performance Indicators
Learn how to create Key Performance Indicators (KPIs) for an Analysis Services tabular model project.
Analysis Services tutorial lesson 10: Create partitions
Learn how to create partitions for an Analysis Services tabular model project.