Buenas noches a todos los presentes.
Soy usuario de un portátil ASUS TUF Gaming FX505DT, y presento el siguiente problema al cual me gustaría encontrar una solución y es que a la hora de jugar a cualquier juego, ya sea uno relativamente moderno como Battlefield V o Deus Ex: Mankind Divided, así como uno que ya tiene sus años como Batman Arkham Asylum o Alan Wake, se me presenta un problema de stuttering o momentos donde se me presentan caídas de FPS , posteriormente buscando en reddit encontré un software llamado LatencyMon relacionado con la latencia del procesador y decidí descargarlo y ejecutarlo, estos fueron los resultados:
CONCLUSION
_________________________________________________________________________________________________________
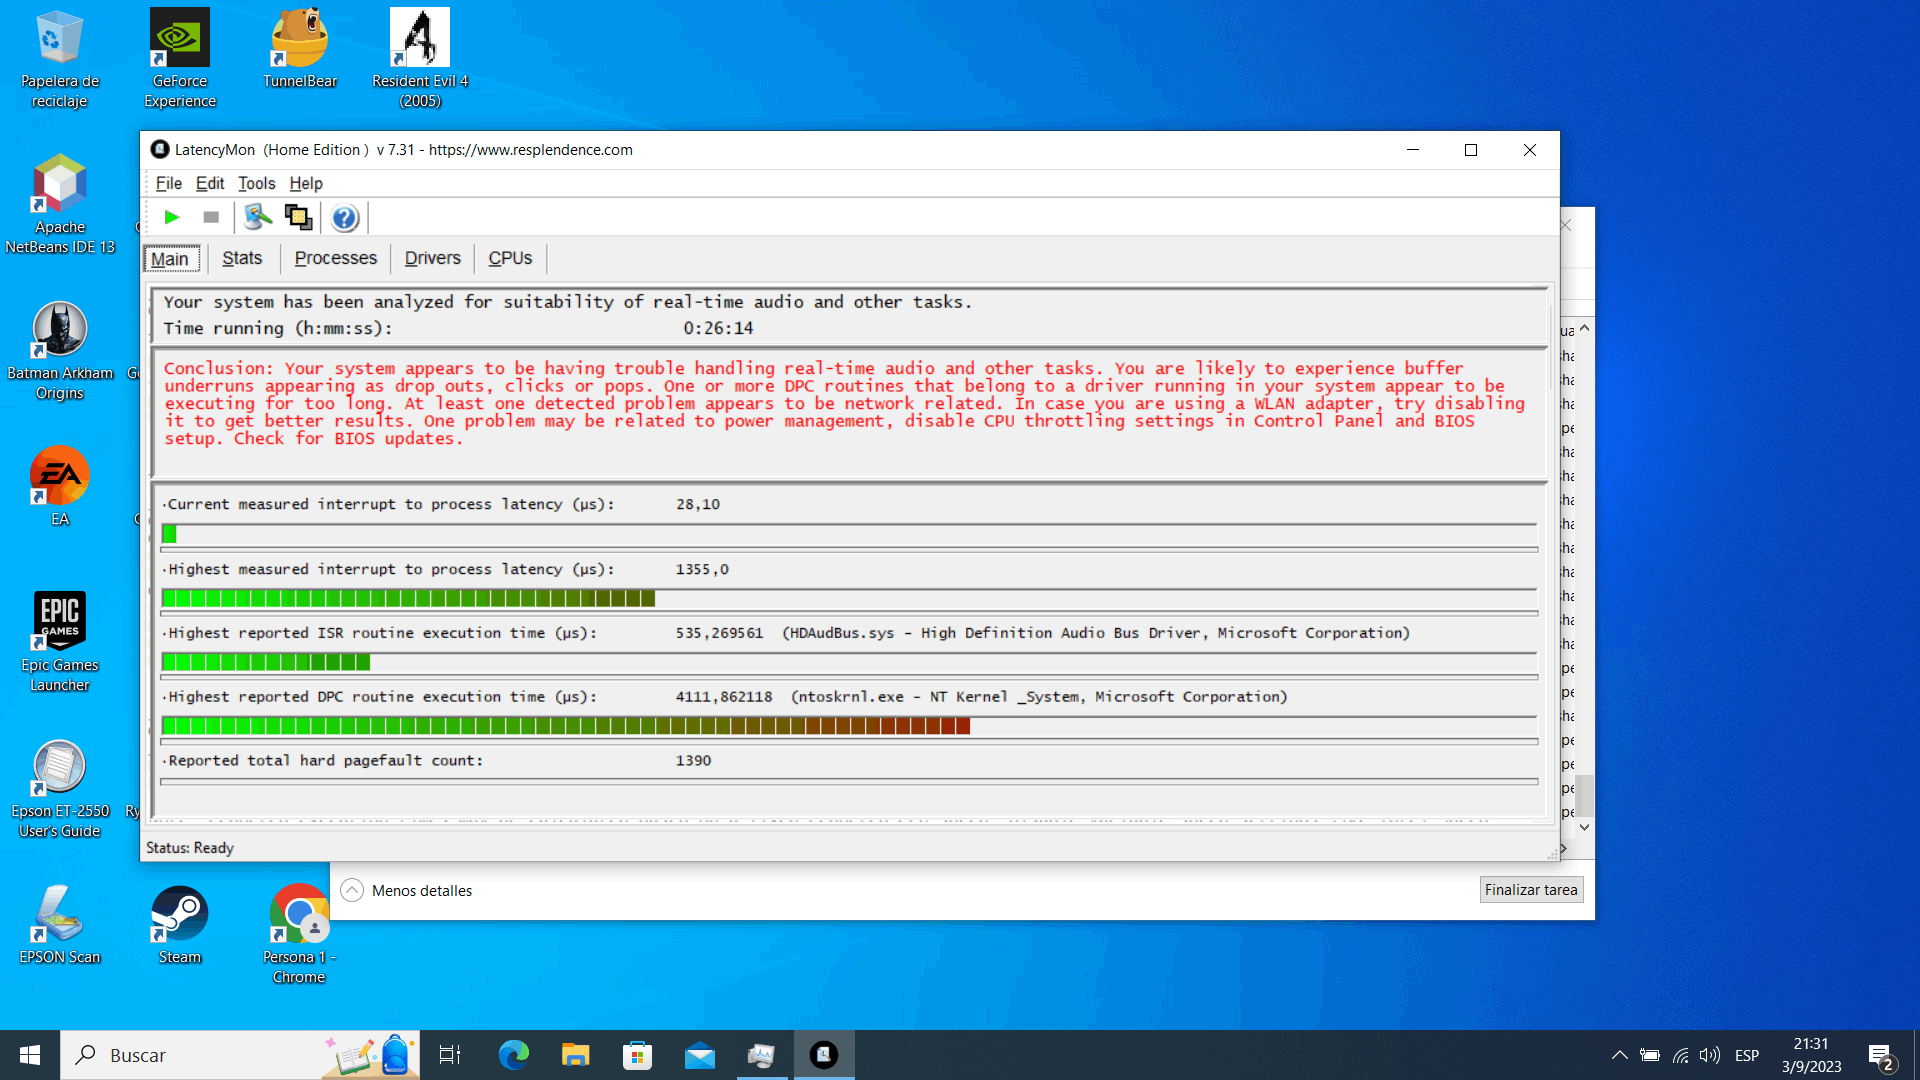
Your system appears to be having trouble handling real-time audio and other tasks. You are likely to experience buffer underruns appearing
as drop outs, clicks or pops. One or more DPC routines that belong to a driver running in your system appear to be executing for too long.
At least one detected problem appears to be network related. In case you are using a WLAN adapter, try disabling it to get better results.
One problem may be related to power management, disable CPU throttling settings in Control Panel and BIOS setup. Check for BIOS updates.
LatencyMon has been analyzing your system for 0:26:14 (h:mm:ss) on all processors.
_________________________________________________________________________________________________________
SYSTEM INFORMATION
_________________________________________________________________________________________________________
Computer name: DESKTOP-62912DG
OS version: Windows 10, 10.0, version 2009, build: 19045 (x64)
Hardware: TUF Gaming FX505DT_FX505DT, ASUSTeK COMPUTER INC.
BIOS: FX505DT.316
CPU: AuthenticAMD AMD Ryzen 5 3550H with Radeon Vega Mobile Gfx
Logical processors: 8
Processor groups: 1
Processor group size: 8
RAM: 32189 MB total
_________________________________________________________________________________________________________
CPU SPEED
_________________________________________________________________________________________________________
Reported CPU speed (WMI): 210 MHz
Reported CPU speed (registry): 2096 MHz
Note: reported execution times may be calculated based on a fixed reported CPU speed. Disable variable speed settings like Intel Speed
Step and AMD Cool N Quiet in the BIOS setup for more accurate results.
_________________________________________________________________________________________________________
MEASURED INTERRUPT TO USER PROCESS LATENCIES
_________________________________________________________________________________________________________
The interrupt to process latency reflects the measured interval that a usermode process needed to respond to a hardware request from the
moment the interrupt service routine started execution. This includes the scheduling and execution of a DPC routine, the signaling of an
event and the waking up of a usermode thread from an idle wait state in response to that event.
Highest measured interrupt to process latency (µs): 1355,0
Average measured interrupt to process latency (µs): 8,671508
Highest measured interrupt to DPC latency (µs): 1263,80
Average measured interrupt to DPC latency (µs): 4,398641
_________________________________________________________________________________________________________
REPORTED ISRs
_________________________________________________________________________________________________________
Interrupt service routines are routines installed by the OS and device drivers that execute in response to a hardware interrupt signal.
Highest ISR routine execution time (µs): 535,269561
Driver with highest ISR routine execution time: HDAudBus.sys - High Definition Audio Bus Driver, Microsoft Corporation
Highest reported total ISR routine time (%): 0,006914
Driver with highest ISR total time: HDAudBus.sys - High Definition Audio Bus Driver, Microsoft Corporation
Total time spent in ISRs (%) 0,010298
ISR count (execution time <250 µs): 261752
ISR count (execution time 250-500 µs): 0
ISR count (execution time 500-1000 µs): 14
ISR count (execution time 1000-2000 µs): 0
ISR count (execution time 2000-4000 µs): 0
ISR count (execution time >=4000 µs): 0
_________________________________________________________________________________________________________
REPORTED DPCs
_________________________________________________________________________________________________________
DPC routines are part of the interrupt servicing dispatch mechanism and disable the possibility for a process to utilize the CPU while it
is interrupted until the DPC has finished execution.
Highest DPC routine execution time (µs): 4111,862118
Driver with highest DPC routine execution time: ntoskrnl.exe - NT Kernel & System, Microsoft Corporation
Highest reported total DPC routine time (%): 0,166944
Driver with highest DPC total execution time: dxgkrnl.sys - DirectX Graphics Kernel, Microsoft Corporation
Total time spent in DPCs (%) 0,299272
DPC count (execution time <250 µs): 3204228
DPC count (execution time 250-500 µs): 0
DPC count (execution time 500-10000 µs): 7085
DPC count (execution time 1000-2000 µs): 16
DPC count (execution time 2000-4000 µs): 0
DPC count (execution time >=4000 µs): 1
_________________________________________________________________________________________________________
REPORTED HARD PAGEFAULTS
_________________________________________________________________________________________________________
Hard pagefaults are events that get triggered by making use of virtual memory that is not resident in RAM but backed by a memory mapped
file on disk. The process of resolving the hard pagefault requires reading in the memory from disk while the process is interrupted and
blocked from execution.
NOTE: some processes were hit by hard pagefaults. If these were programs producing audio, they are likely to interrupt the audio stream
resulting in dropouts, clicks and pops. Check the Processes tab to see which programs were hit.
Process with highest pagefault count: explorer.exe
Total number of hard pagefaults 1390
Hard pagefault count of hardest hit process: 349
Number of processes hit: 22
_________________________________________________________________________________________________________
PER CPU DATA
_________________________________________________________________________________________________________
CPU 0 Interrupt cycle time (s): 105,557339
CPU 0 ISR highest execution time (µs): 535,269561
CPU 0 ISR total execution time (s): 0,685231
CPU 0 ISR count: 121182
CPU 0 DPC highest execution time (µs): 4111,862118
CPU 0 DPC total execution time (s): 26,186631
CPU 0 DPC count: 2634800
_________________________________________________________________________________________________________
CPU 1 Interrupt cycle time (s): 32,592938
CPU 1 ISR highest execution time (µs): 534,748569
CPU 1 ISR total execution time (s): 0,362327
CPU 1 ISR count: 59072
CPU 1 DPC highest execution time (µs): 1064,357347
CPU 1 DPC total execution time (s): 7,824046
CPU 1 DPC count: 206610
_________________________________________________________________________________________________________
CPU 2 Interrupt cycle time (s): 11,326236
CPU 2 ISR highest execution time (µs): 453,694179
CPU 2 ISR total execution time (s): 0,177295
CPU 2 ISR count: 28107
CPU 2 DPC highest execution time (µs): 690,675573
CPU 2 DPC total execution time (s): 1,730138
CPU 2 DPC count: 99417
_________________________________________________________________________________________________________
CPU 3 Interrupt cycle time (s): 5,599866
CPU 3 ISR highest execution time (µs): 19,266698
CPU 3 ISR total execution time (s): 0,012474
CPU 3 ISR count: 6303
CPU 3 DPC highest execution time (µs): 533,426050
CPU 3 DPC total execution time (s): 0,201785
CPU 3 DPC count: 38390
_________________________________________________________________________________________________________
CPU 4 Interrupt cycle time (s): 5,851926
CPU 4 ISR highest execution time (µs): 16,331107
CPU 4 ISR total execution time (s): 0,008499
CPU 4 ISR count: 7431
CPU 4 DPC highest execution time (µs): 257,770992
CPU 4 DPC total execution time (s): 0,322371
CPU 4 DPC count: 68212
_________________________________________________________________________________________________________
CPU 5 Interrupt cycle time (s): 4,999937
CPU 5 ISR highest execution time (µs): 6,953244
CPU 5 ISR total execution time (s): 0,006097
CPU 5 ISR count: 5052
CPU 5 DPC highest execution time (µs): 531,442271
CPU 5 DPC total execution time (s): 0,157196
CPU 5 DPC count: 36257
_________________________________________________________________________________________________________
CPU 6 Interrupt cycle time (s): 7,617395
CPU 6 ISR highest execution time (µs): 15,639790
CPU 6 ISR total execution time (s): 0,011041
CPU 6 ISR count: 8649
CPU 6 DPC highest execution time (µs): 625,351145
CPU 6 DPC total execution time (s): 0,586528
CPU 6 DPC count: 67369
_________________________________________________________________________________________________________
CPU 7 Interrupt cycle time (s): 7,412387
CPU 7 ISR highest execution time (µs): 140,327290
CPU 7 ISR total execution time (s): 0,033881
CPU 7 ISR count: 25970
CPU 7 DPC highest execution time (µs): 564,284828
CPU 7 DPC total execution time (s): 0,679412
CPU 7 DPC count: 60275
_________________________________________________________________________________________________________
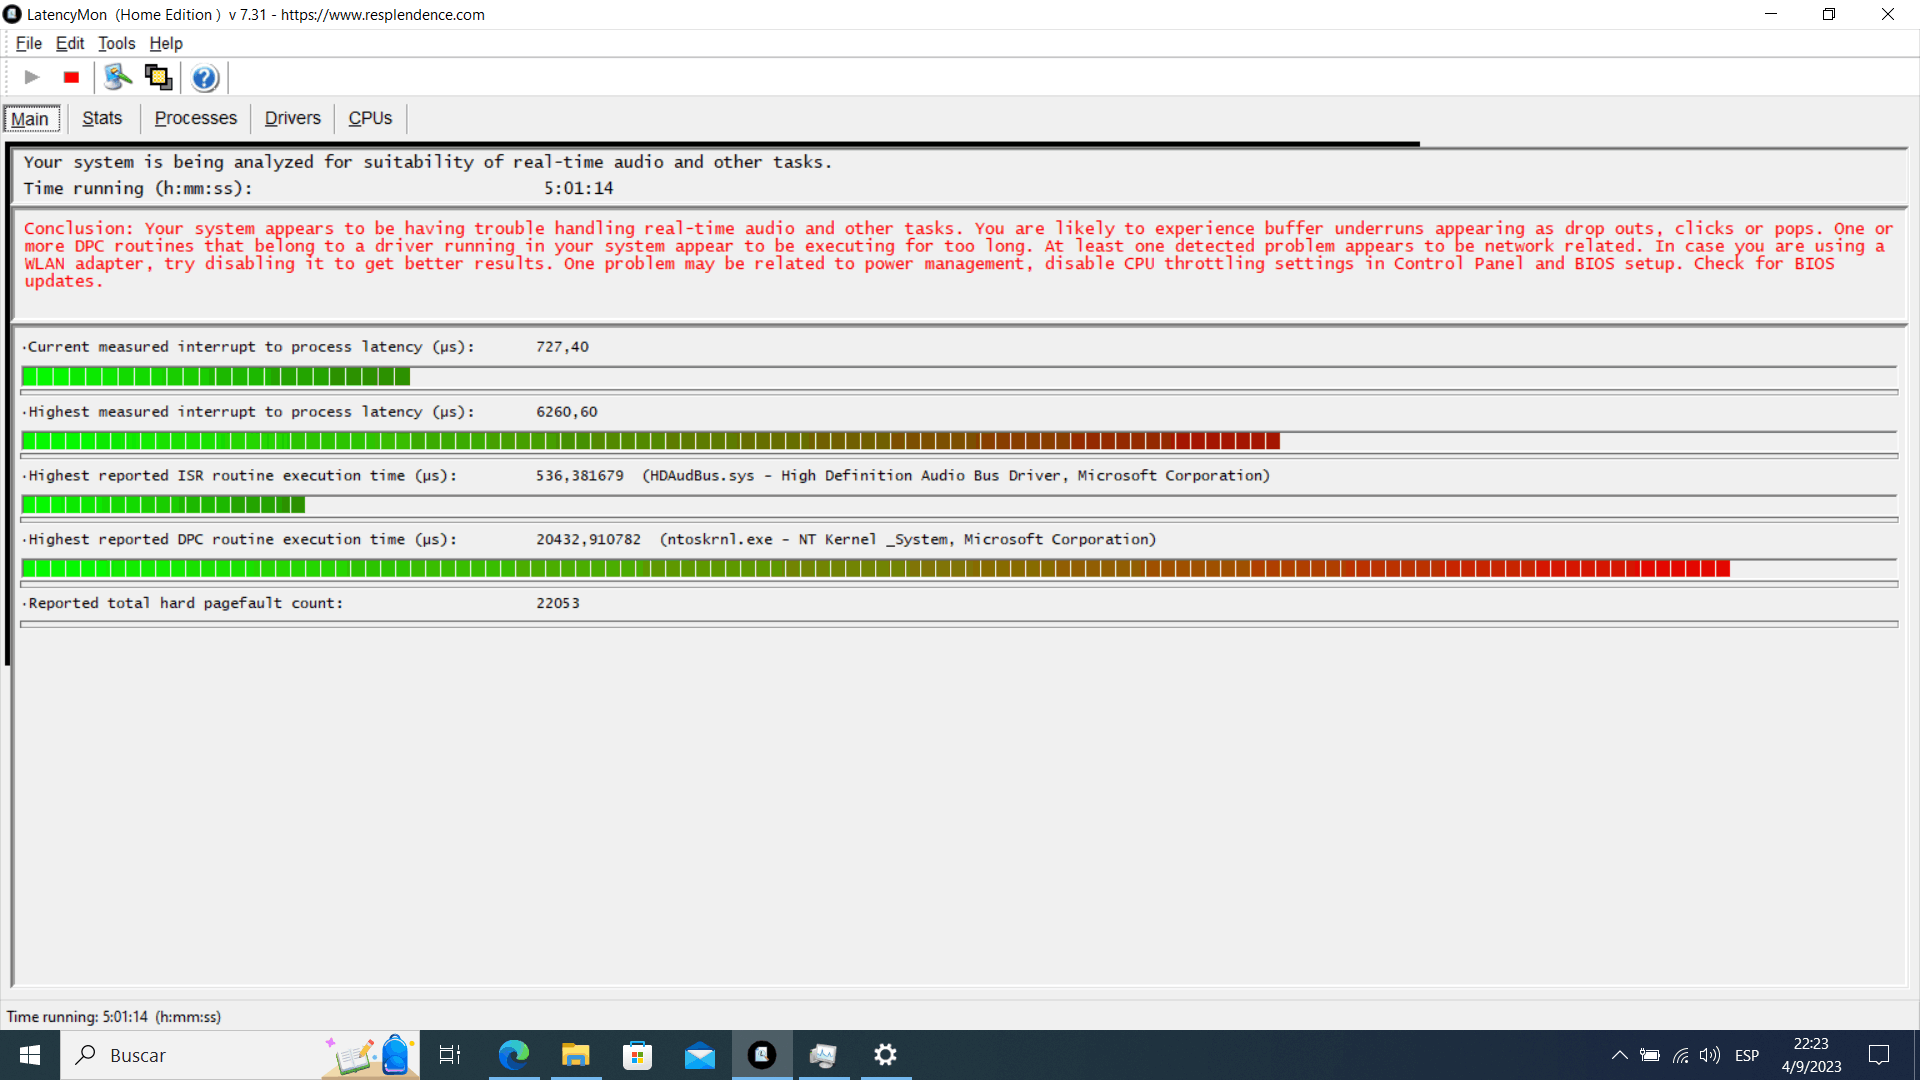
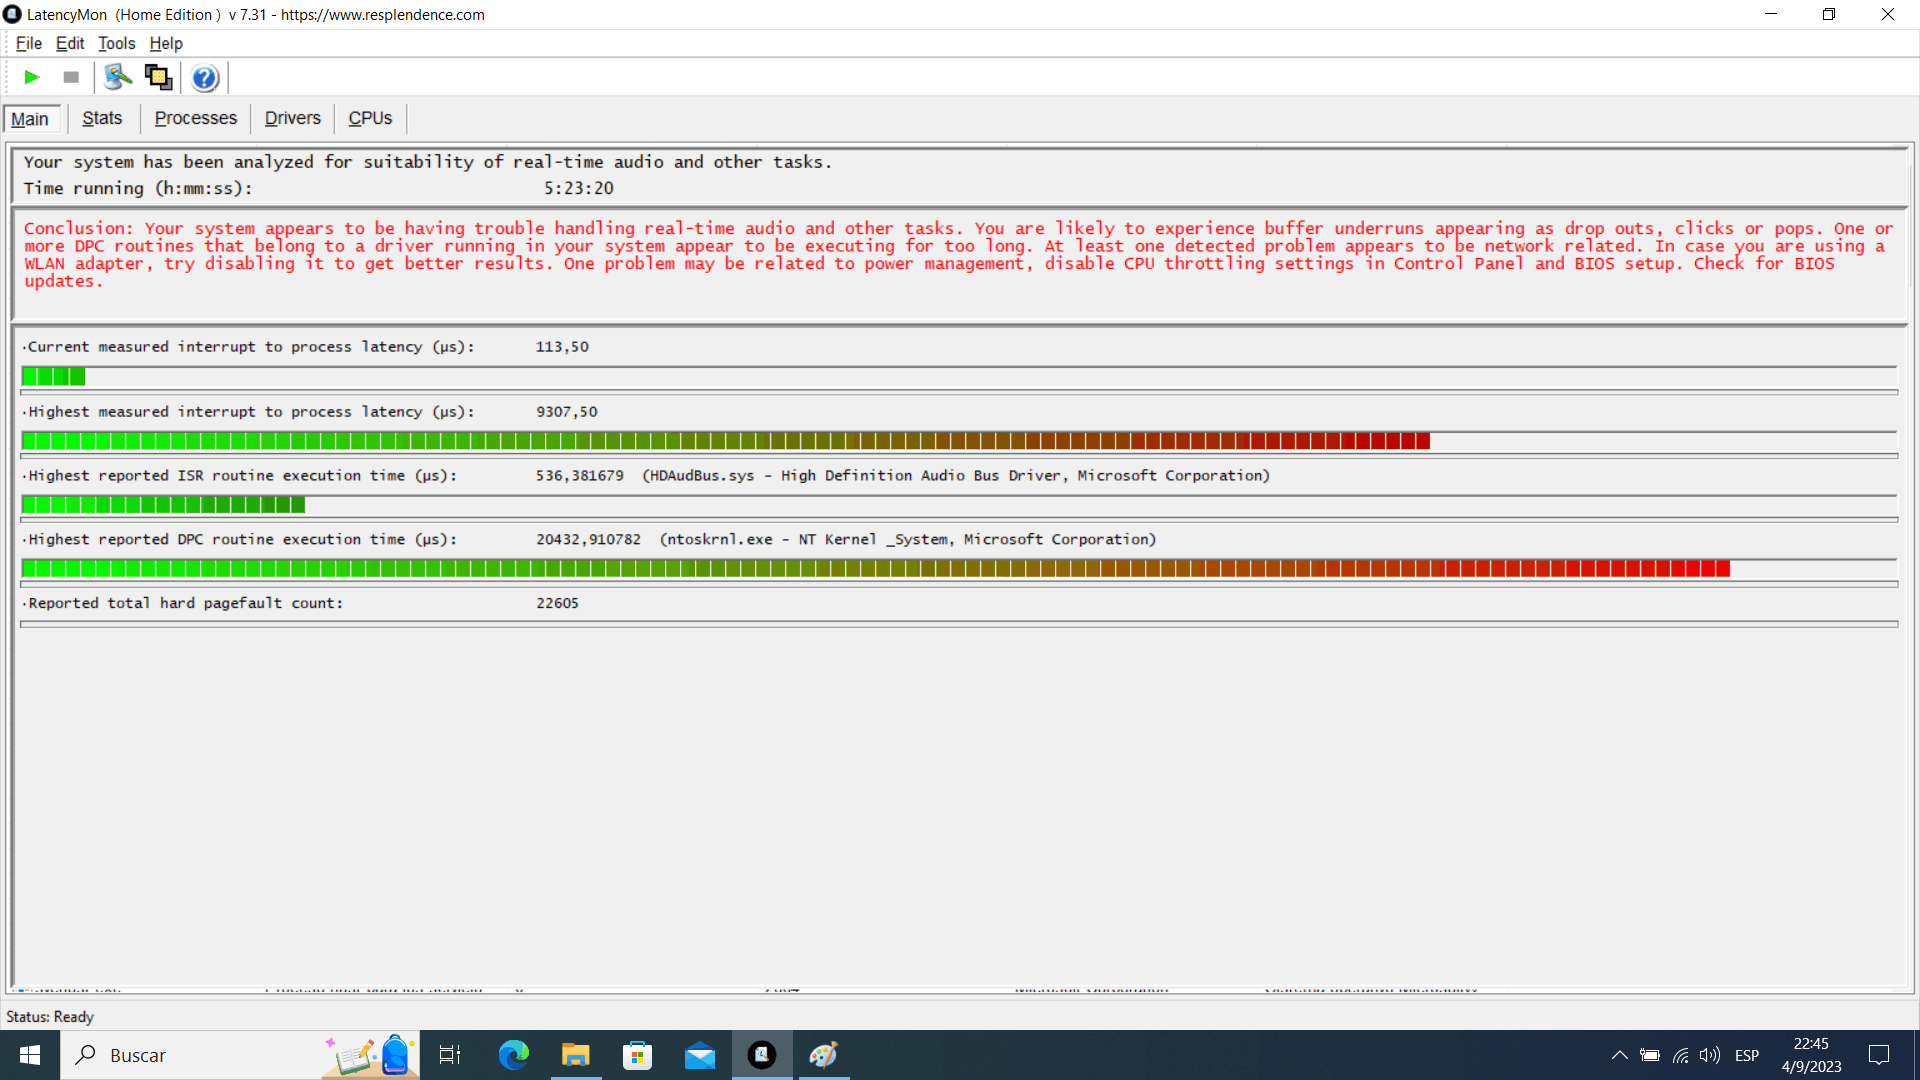
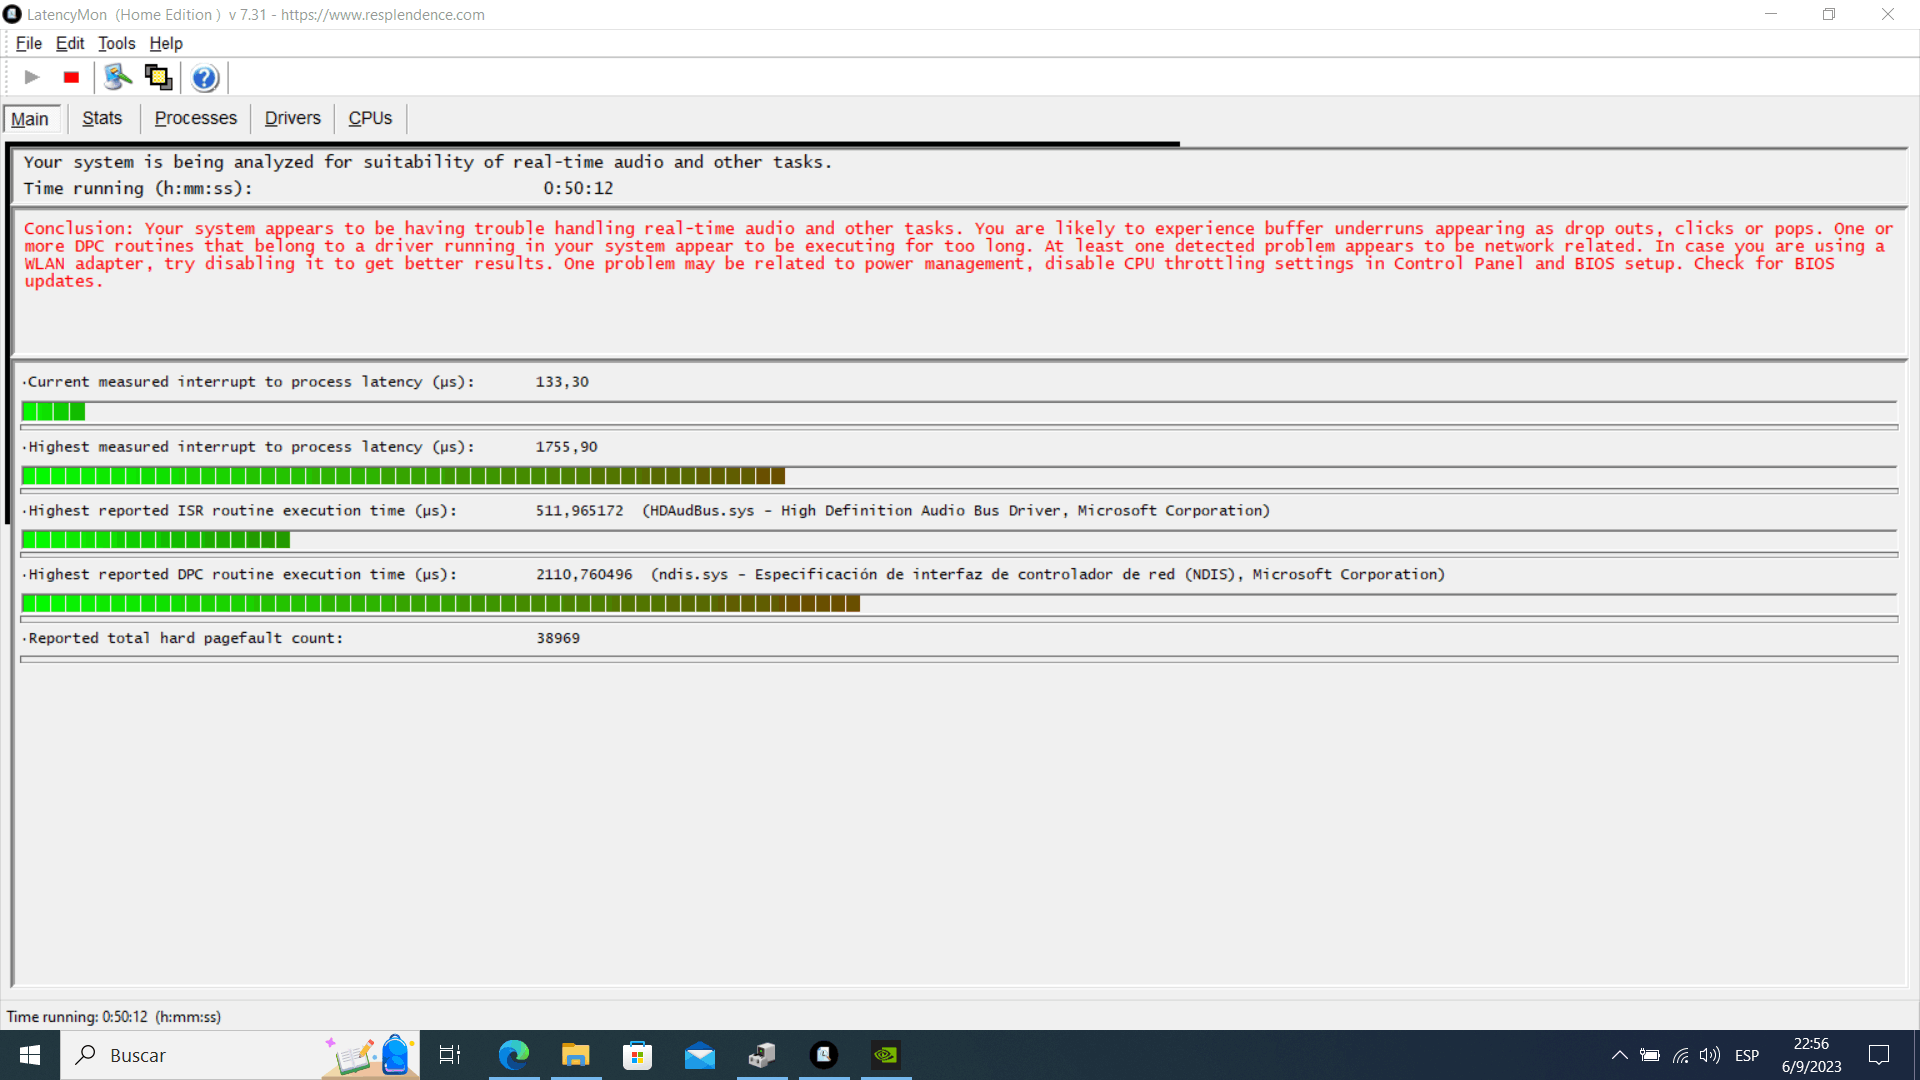
He revisado que en foros asi como en videos que desactivando por el momento los adaptares de red en administrar dispositivos se reducen las latencias, lo que he hecho pero me dan resultados algo preocupante :
https://drive.google.com/file/d/1ZKFNZCa-TjAy6YYMa-0rGwV4vzQZL0EF/view?usp=drive_link
Algunas capturas de pantalla de pruebas que hice con LatencyMon:
1
2
3
 4
4
5.
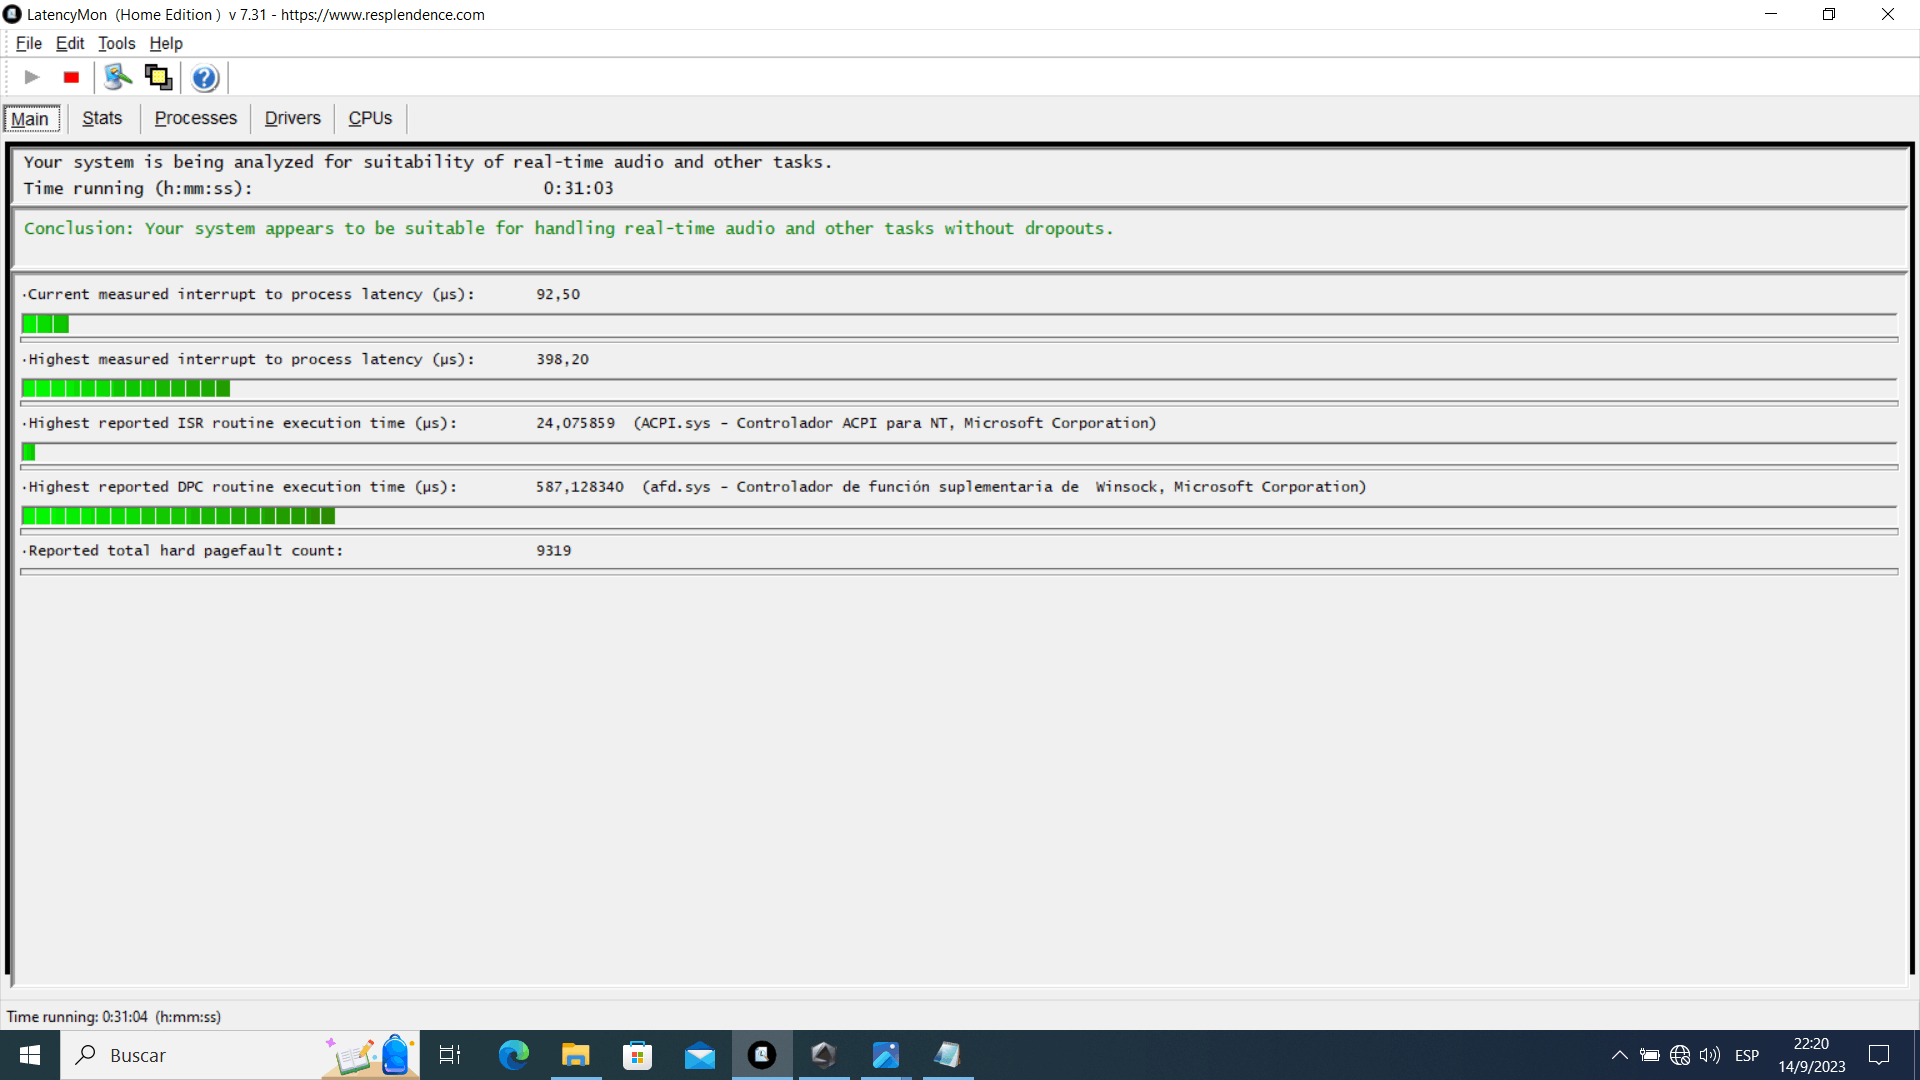
Examen actual con adaptadores de red activados:
https://drive.google.com/file/d/1vWGsAcWmqO2JqdeOru8U-Z8_yCHNnMoA/view?usp=sharing
CONCLUSION
_________________________________________________________________________________________________________
Your system seems to be having difficulty handling real-time audio and other tasks. You may experience drop outs, clicks or pops due to buffer underruns. One or more DPC routines that
belong to a driver running in your system appear to be executing for too long. At least one detected problem appears to be network related. In case you are using a WLAN adapter, try
disabling it to get better results. One problem may be related to power management, disable CPU throttling settings in Control Panel and BIOS setup. Check for BIOS updates.
LatencyMon has been analyzing your system for  0:23:27  (h:mm:ss) on all processors.

_________________________________________________________________________________________________________
SYSTEM INFORMATION
_________________________________________________________________________________________________________
Computer name:                                        DESKTOP-62912DG
OS version:                                           Windows 10, 10.0, version 2009, build: 19045 (x64)
Hardware:                                             TUF Gaming FX505DT_FX505DT, ASUSTeK COMPUTER INC.
BIOS:                                                 FX505DT.316
CPU:                                                  AuthenticAMD AMD Ryzen 5 3550H with Radeon Vega Mobile Gfx
Logical processors:                                   8
Processor groups:                                     1
Processor group size:                                 8
RAM:                                                  32189 MB total

_________________________________________________________________________________________________________
CPU SPEED
_________________________________________________________________________________________________________
Reported CPU speed (WMI):                             210 MHz
Reported CPU speed (registry):                        2096 MHz

Note: reported execution times may be calculated based on a fixed reported CPU speed. Disable variable speed settings like Intel Speed Step and AMD Cool N Quiet in the BIOS setup for more
accurate results.

_________________________________________________________________________________________________________
MEASURED INTERRUPT TO USER PROCESS LATENCIES
_________________________________________________________________________________________________________
The interrupt to process latency reflects the measured interval that a usermode process needed to respond to a hardware request from the moment the interrupt service routine started
execution. This includes the scheduling and execution of a DPC routine, the signaling of an event and the waking up of a usermode thread from an idle wait state in response to that event.

Highest measured interrupt to process latency (µs):   809,10
Average measured interrupt to process latency (µs):   6,228108

Highest measured interrupt to DPC latency (µs):       804,70
Average measured interrupt to DPC latency (µs):       2,657748

_________________________________________________________________________________________________________
 REPORTED ISRs
_________________________________________________________________________________________________________
Interrupt service routines are routines installed by the OS and device drivers that execute in response to a hardware interrupt signal.

Highest ISR routine execution time (µs):              116,461832
Driver with highest ISR routine execution time:       Wdf01000.sys - Motor en tiempo de ejecución del marco de controlador en modo kernel, Microsoft Corporation

Highest reported total ISR routine time (%):          0,003560
Driver with highest ISR total time:                   Wdf01000.sys - Motor en tiempo de ejecución del marco de controlador en modo kernel, Microsoft Corporation

Total time spent in ISRs (%)                          0,003722

ISR count (execution time <250 µs):                   215638
ISR count (execution time 250-500 µs):                0
ISR count (execution time 500-1000 µs):               0
ISR count (execution time 1000-2000 µs):              0
ISR count (execution time 2000-4000 µs):              0
ISR count (execution time >=4000 µs):                 0

_________________________________________________________________________________________________________
REPORTED DPCs
_________________________________________________________________________________________________________
DPC routines are part of the interrupt servicing dispatch mechanism and disable the possibility for a process to utilize the CPU while it is interrupted until the DPC has finished
execution.

Highest DPC routine execution time (µs):              1813,514313
Driver with highest DPC routine execution time:       dxgkrnl.sys - DirectX Graphics Kernel, Microsoft Corporation

Highest reported total DPC routine time (%):          0,059822
Driver with highest DPC total execution time:         Wdf01000.sys - Motor en tiempo de ejecución del marco de controlador en modo kernel, Microsoft Corporation

Total time spent in DPCs (%)                          0,171165

DPC count (execution time <250 µs):                   1525707
DPC count (execution time 250-500 µs):                0
DPC count (execution time 500-10000 µs):              611
DPC count (execution time 1000-2000 µs):              2
DPC count (execution time 2000-4000 µs):              0
DPC count (execution time >=4000 µs):                 0

_________________________________________________________________________________________________________
 REPORTED HARD PAGEFAULTS
_________________________________________________________________________________________________________
Hard pagefaults are events that get triggered by making use of virtual memory that is not resident in RAM but backed by a memory mapped file on disk. The process of resolving the hard
pagefault requires reading in the memory from disk while the process is interrupted and blocked from execution.

NOTE: some processes were hit by hard pagefaults. If these were programs producing audio, they are likely to interrupt the audio stream resulting in dropouts, clicks and pops. Check the
Processes tab to see which programs were hit.

Process with highest pagefault count:                 hxoutlook.exe

Total number of hard pagefaults                       22788
Hard pagefault count of hardest hit process:          4837
Number of processes hit:                              89

_________________________________________________________________________________________________________
 PER CPU DATA
_________________________________________________________________________________________________________
CPU 0 Interrupt cycle time (s):                       38,501663
CPU 0 ISR highest execution time (µs):                116,461832
CPU 0 ISR total execution time (s):                   0,316333
CPU 0 ISR count:                                      142179
CPU 0 DPC highest execution time (µs):                1813,514313
CPU 0 DPC total execution time (s):                   15,126048
CPU 0 DPC count:                                      1118473
_________________________________________________________________________________________________________
CPU 1 Interrupt cycle time (s):                       9,321886
CPU 1 ISR highest execution time (µs):                29,716603
CPU 1 ISR total execution time (s):                   0,031881
CPU 1 ISR count:                                      14394
CPU 1 DPC highest execution time (µs):                708,279103
CPU 1 DPC total execution time (s):                   1,827129
CPU 1 DPC count:                                      99705
_________________________________________________________________________________________________________
CPU 2 Interrupt cycle time (s):                       6,431672
CPU 2 ISR highest execution time (µs):                14,066794
CPU 2 ISR total execution time (s):                   0,010049
CPU 2 ISR count:                                      7743
CPU 2 DPC highest execution time (µs):                621,353531
CPU 2 DPC total execution time (s):                   0,521388
CPU 2 DPC count:                                      69688
_________________________________________________________________________________________________________
CPU 3 Interrupt cycle time (s):                       5,939148
CPU 3 ISR highest execution time (µs):                18,605439
CPU 3 ISR total execution time (s):                   0,012446
CPU 3 ISR count:                                      10606
CPU 3 DPC highest execution time (µs):                329,227099
CPU 3 DPC total execution time (s):                   0,369881
CPU 3 DPC count:                                      49736
_________________________________________________________________________________________________________
CPU 4 Interrupt cycle time (s):                       6,129255
CPU 4 ISR highest execution time (µs):                8,035305
CPU 4 ISR total execution time (s):                   0,009583
CPU 4 ISR count:                                      8498
CPU 4 DPC highest execution time (µs):                565,747615
CPU 4 DPC total execution time (s):                   0,501234
CPU 4 DPC count:                                      70283
_________________________________________________________________________________________________________
CPU 5 Interrupt cycle time (s):                       4,440850
CPU 5 ISR highest execution time (µs):                9,317748
CPU 5 ISR total execution time (s):                   0,004991
CPU 5 ISR count:                                      4107
CPU 5 DPC highest execution time (µs):                531,522424
CPU 5 DPC total execution time (s):                   0,149061
CPU 5 DPC count:                                      24223
_________________________________________________________________________________________________________
CPU 6 Interrupt cycle time (s):                       7,38940
CPU 6 ISR highest execution time (µs):                13,375477
CPU 6 ISR total execution time (s):                   0,010531
CPU 6 ISR count:                                      9071
CPU 6 DPC highest execution time (µs):                348,263359
CPU 6 DPC total execution time (s):                   0,544822
CPU 6 DPC count:                                      65098
_________________________________________________________________________________________________________
CPU 7 Interrupt cycle time (s):                       4,670628
CPU 7 ISR highest execution time (µs):                11,381679
CPU 7 ISR total execution time (s):                   0,023226
CPU 7 ISR count:                                      19040
CPU 7 DPC highest execution time (µs):                630,060115
CPU 7 DPC total execution time (s):                   0,230397
CPU 7 DPC count:                                      29114
_________________________________________________________________________________________________________
' cx='32' cy='32' r='32' /%3E%3Ctext x='50%25' y='55%25' dominant-baseline='middle' text-anchor='middle' fill='%23FFF' %3EA%3C/text%3E%3C/svg%3E)