Azure Monitor
An Azure service that is used to collect, analyze, and act on telemetry data from Azure and on-premises environments.
This browser is no longer supported.
Upgrade to Microsoft Edge to take advantage of the latest features, security updates, and technical support.
' cx='32' cy='32' r='32' /%3E%3Ctext x='50%25' y='55%25' dominant-baseline='middle' text-anchor='middle' fill='%23FFF' %3ESK%3C/text%3E%3C/svg%3E)
Hi,
The total failed requests for an endpoint on API for last 24 hours is 2k as shown below
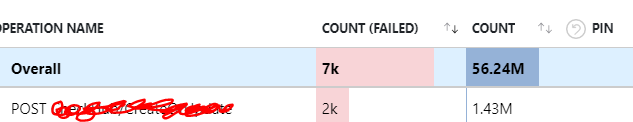
But when I click on the failed requests and I see only 2 failed request with time of failure in last 24 hours.

I want to confirm what is the actual count of this failure?
' cx='32' cy='32' r='32' /%3E%3Ctext x='50%25' y='55%25' dominant-baseline='middle' text-anchor='middle' fill='%23FFF' %3EAM%3C/text%3E%3C/svg%3E)
@sonal khatri , thank you for posting this question here. I understand that you are trying to see the failures in the application from "Failures" option of the ApplicationInsights.
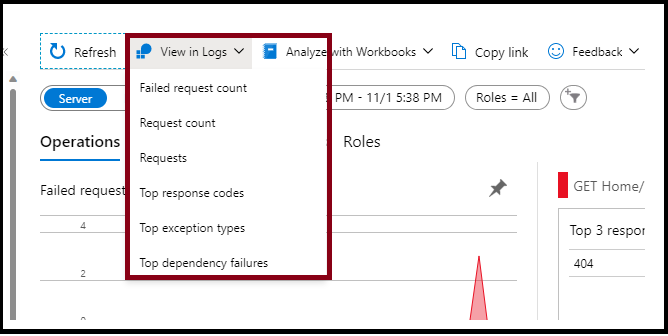
It seems that the screenshot shared are for one of the top 3 response code only and it appears that you have selected "Error code 409" to be viewed. Refer to the screenshot below:

Note that the failures could also be related to Exceptions (2), dependencies(3). All this data is pulled from the ApplicationInsights logs and if required, you could also check the suggested queries as highlighted below.
Hope this helps. Please let us know if you have any questions.
@sonal khatri , Following up to see if my answer helps. Do let me know if you have any queries.
Please 'Accept as answer' and ‘Upvote’ if it helped so that it can help others in the community looking for help on similar topics.