ASP.NET
A set of technologies in the .NET Framework for building web applications and XML web services.
3,252 questions
This browser is no longer supported.
Upgrade to Microsoft Edge to take advantage of the latest features, security updates, and technical support.
' cx='32' cy='32' r='32' /%3E%3Ctext x='50%25' y='55%25' dominant-baseline='middle' text-anchor='middle' fill='%23FFF' %3EJH%3C/text%3E%3C/svg%3E)
Hi, Is there a way to add secondary yaxis in Chart class of system.web.helper.chart? My current code: string temp = @"<Chart> <ChartAreas> <ChartArea Name=""Default"" Template=""All""> <AxisY> <LabelStyle Font=""Verdana, 12px"" /> </AxisY> <AxisY> <LabelStyle Font=""Verdana, 12px"" /> </AxisY> <AxisX LineColor=""64, 64, 64, 64"" Interval=""1""> <LabelStyle Font=""Verdana, 12px"" /> </AxisX> </ChartArea> </ChartAreas> </Chart>"; var myChart = new Chart(width:1200, height: 300,theme:temp).AddTitle("Test Graph").AddLegend();

Adding right tags/teams to assist
' cx='32' cy='32' r='32' /%3E%3Ctext x='50%25' y='55%25' dominant-baseline='middle' text-anchor='middle' fill='%23FFF' %3EYS%3C/text%3E%3C/svg%3E)
Hi @Jeswani, Hitesh (Navi Mumbai) ,
Is there a way to add secondary yaxis in Chart class of system.web.helper.chart?
You need to specify a name for each AxisY or AxisX. I wrote an example, you can refer to it.
Model
        public class ChartTestModel
        {
            public int test1 { get; set; }
            public int test2 { get; set; }
            public int test3 { get; set; }
        }
Controller
    public class ChartTestController : Controller
    {
        public ActionResult Index()
        {
            Random random = new Random();
            List<ChartTestModel> test = new List<ChartTestModel>();
            for(int i = 1; i < 6; i++)
            {
                test.Add(new ChartTestModel { test2 = random.Next(20, 90), test3= random.Next(50, 100), test1= i });
            }
            string temp = @"<Chart>
                                <ChartAreas>
                                    <ChartArea Name=""Default"" _Template_=""All"">
                                         <AxisY Name=""FirstY"">
                                            <LabelStyle Font=""Verdana, 12px"" />
                                        </AxisY>
                                         <AxisY Name=""SecondY"">
                                            <LabelStyle Font=""Verdana, 12px"" />
                                        </AxisY>
                                        <AxisX Name=""FirstX"" LineColor=""64, 64, 64, 64"" Interval=""1"">
                                            <LabelStyle Font=""Verdana, 12px"" />
                                        </AxisX>
                                    </ChartArea>
                                </ChartAreas>
                            </Chart>";
            var myChart = new Chart(width: 1200, height: 300, theme: temp).AddTitle("Test").AddLegend();
            var bytes = new Chart(width: 850, height: 400, theme: temp)
            .AddSeries(
                        xValue: test.Select(m => m.test1).ToArray(),xField: "FirstX",
                        yValues: test.Select(m => m.test2).ToArray(),yFields: "FirstY"
                      )
            .AddSeries(
                        xValue: test.Select(m => m.test1).ToArray(), xField: "FirstX",
                        yValues: test.Select(m => m.test3).ToArray(), yFields: "SecondY"
                      )
            .GetBytes("png");
            return File(bytes, "image/png");
        }
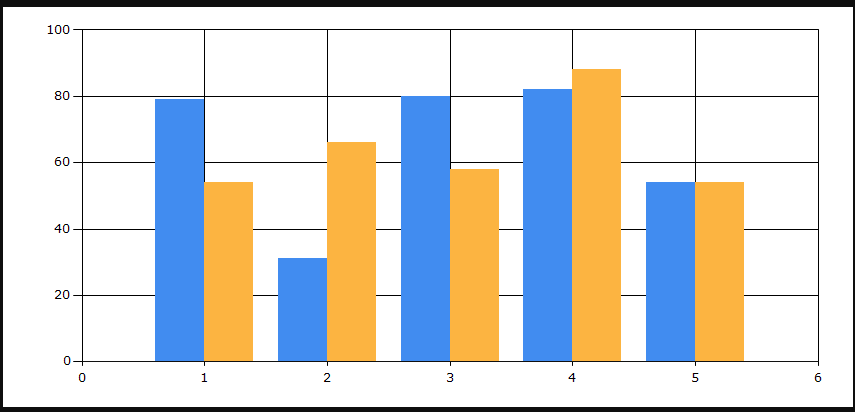
Result
If the answer is helpful, please click "Accept Answer" and upvote it.
Note: Please follow the steps in our documentation to enable e-mail notifications if you want to receive the related email notification for this thread.
Best Regards,
YihuiSun