Azure Data Factory
An Azure service for ingesting, preparing, and transforming data at scale.
9,529 questions
This browser is no longer supported.
Upgrade to Microsoft Edge to take advantage of the latest features, security updates, and technical support.
' cx='32' cy='32' r='32' /%3E%3Ctext x='50%25' y='55%25' dominant-baseline='middle' text-anchor='middle' fill='%23FFF' %3EDB%3C/text%3E%3C/svg%3E)
For very basic activities (eg lookup) I'm finding large differences in performance between one execution of a pipeline and the next.
For example the following sometimes runs in 3 seconds and other times runs in 20 seconds.
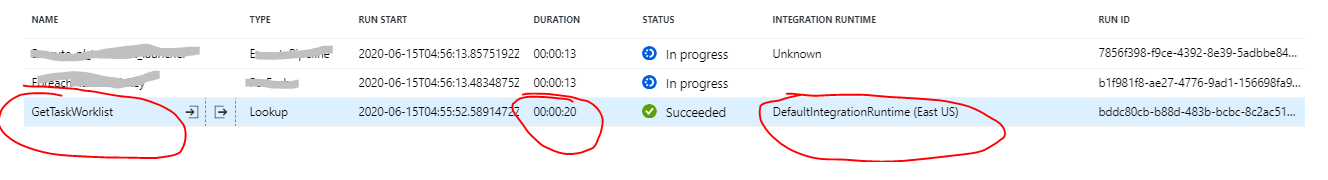
What can I do to investigate these types of performance inconsistencies? In this case the lookup is running a stored procedure in an azure-hosted sql database via the "AutoResolveIntegrationRuntime". When I monitor xevents in the database, the query executes instantaneously. The performance problems must be happening in ADF or in the integration runtime itself (autoresolve runtime).
Essentially I'm asking where I get profiling information. Preferrably this type of profiling would be available both in the real ADF environment and in the debug environment.
Side question. Is the "auto resolve integration runtime" shared with lots of other customers? Is there a chance that my stuff is getting queued up behind a dozen other customers in the US east region? If so , then is there a way to monitor how busy that integration runtime is at any given moment? Is there a service tier where I don't share my "auto resolve" with other customers?
I still don't have a formal document that says so, but Microsoft engineers are standing by their undocumented "SLA" that says any interaction with a stored procedure in SQL may take up to four minutes. This includes an Azure SQL resource in the same azure region.
So, if a stored procedure should execute in 1 second, the ADF IR is reasonably permitted to spend an extra 4 minutes going to sleep, or doing whatever else it feels like doing. In practice I've noticed that the IR can often spend an additional 10 or 20 seconds doing nothing at all. Microsoft claims there are no configuration options (even in the self-hosted IR) to adjust that time that is being wasted.
If you see an IR going to sleep for longer than 4 minutes per activity, then that justifies opening a support ticket to troubleshoot performance.
Here is the complete response from the support engineer (Tyler, Big Data Support Engineer):
As stated from the Product Team, any stored procedure activity that performs within 4 minutes has met SLA within ADF--this SLA covers the overhead of ADF communicating with SQL server. With that said, your current performance within ADF is normal.
Here is the four minute SLA for all activity runs!
https://azure.microsoft.com/en-gb/support/legal/sla/data-factory/v1_2/
I would appreciate it.
I suspected the same type of thing that you described. There is some async worker in the integration runtime that is polling for new work (rather than allowing clients to make their own synchronous requests on demand). The async nature of the worker allows it to be a lot more "lazy" than it should be.
I would also suspect that there are configuration settings that might be tweaked to tell the async worker to do more polling, more frequently... so that new work doesn't just sit around for ten minutes. I would guess that your reproducible could run up to 5x faster if the async workers weren't as "lazy" as they are right now.
There is probably a trade-off or compromise that would be made by tweaking configuration (ie. higher CPU or more network traffic). This is probably a compromise we would be willing to make in our development environment. Nobody wants to sit around for 10 mins, only to wait for 1 second's worth of real SQL activity!
' cx='32' cy='32' r='32' /%3E%3Ctext x='50%25' y='55%25' dominant-baseline='middle' text-anchor='middle' fill='%23FFF' %3EMM%3C/text%3E%3C/svg%3E)
Well I haven't gotten an answer to my inquiry, but to the best of my understanding, it is the case of shared workers taking jobs from a queue. This is part of the back-end and not accessible in any way by users.