Azure Monitor
An Azure service that is used to collect, analyze, and act on telemetry data from Azure and on-premises environments.
2,786 questions
This browser is no longer supported.
Upgrade to Microsoft Edge to take advantage of the latest features, security updates, and technical support.
' cx='32' cy='32' r='32' /%3E%3Ctext x='50%25' y='55%25' dominant-baseline='middle' text-anchor='middle' fill='%23FFF' %3EVP%3C/text%3E%3C/svg%3E)

@Vijay Patil Welcome to Microsoft Q&A and thank you for your query.
If I run the same query in one of our demo Log Analytics workspace , was able get the output.
Can you please further expand on from where exactly you are running this query and do you data being sent to the Log Management --> Perf table ? so that we can help you to troubleshoot the issue further. Thanks
@Vijay Patil Checking in to see if you had a chance to review the above comments and have any further queries. Thank you
<<Sharing the information here for broader community usage>>
@Vijay Patil Welcome to Microsoft Q&A and thank you for your query. Please make sure to enable the perf collection first , follow through this documentation.
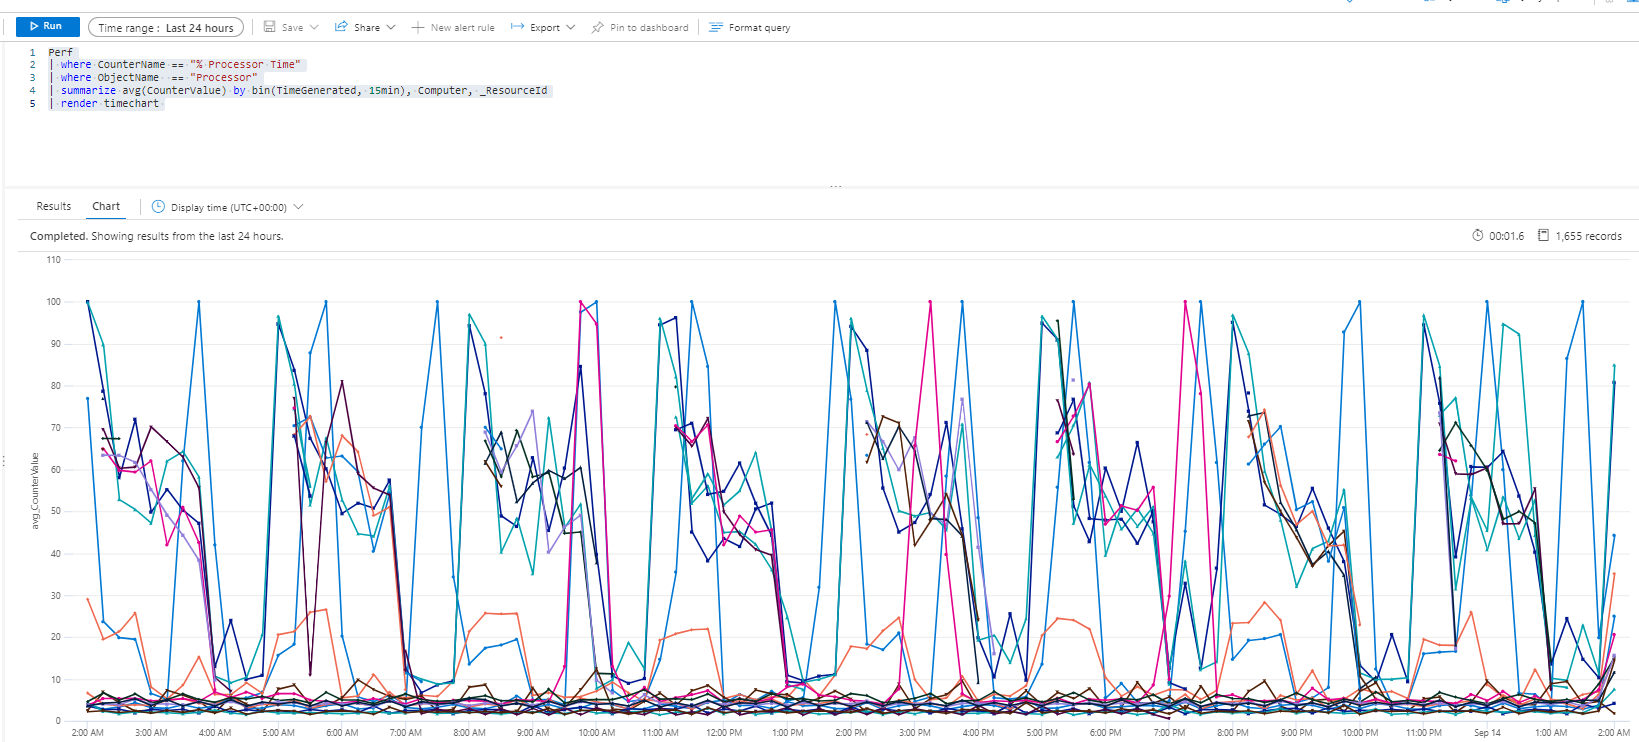
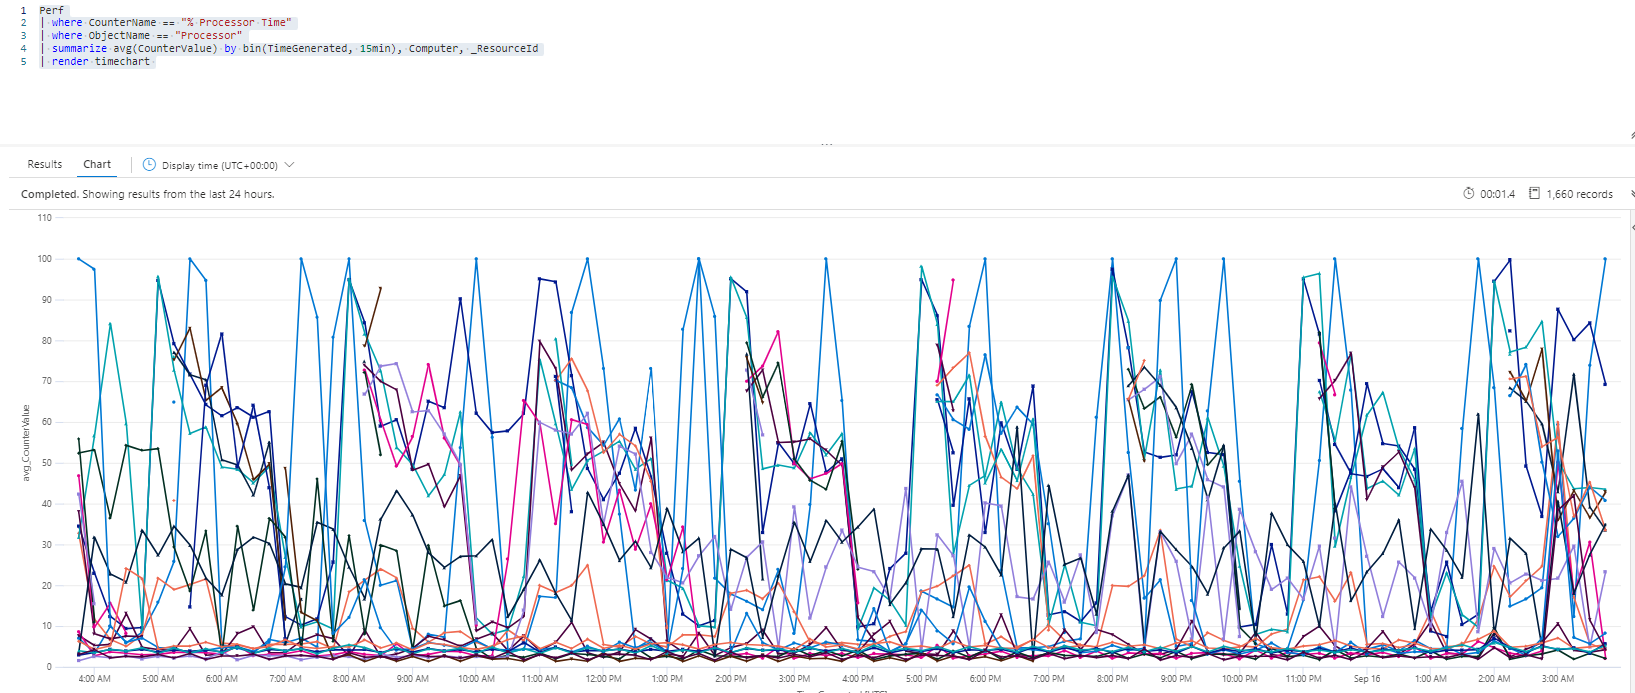
Provided the information is being sent to LogAnalytics workspace and the respective Perf table, we should be able to run the below query. Ran it on one of our demo workspace, which gave the below output.
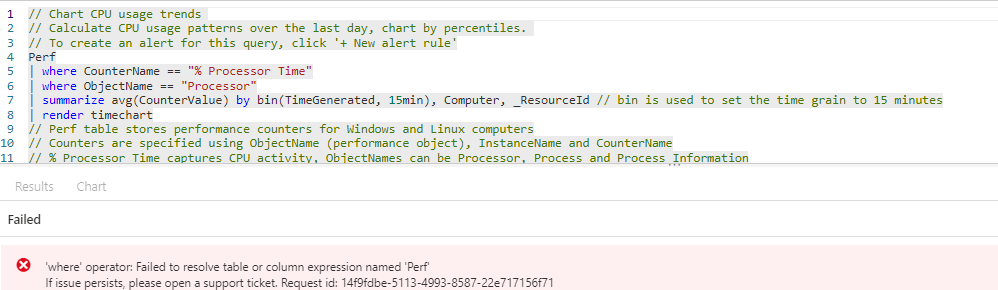
Perf
| where CounterName == "% Processor Time"
| where ObjectName == "Processor"
| summarize avg(CounterValue) by bin(TimeGenerated, 15min), Computer, _ResourceId
| render timechart
Please let us know if you have any further queries, thank you.