ASP.NET
A set of technologies in the .NET Framework for building web applications and XML web services.
3,253 questions
This browser is no longer supported.
Upgrade to Microsoft Edge to take advantage of the latest features, security updates, and technical support.
' cx='32' cy='32' r='32' /%3E%3Ctext x='50%25' y='55%25' dominant-baseline='middle' text-anchor='middle' fill='%23FFF' %3EMJ%3C/text%3E%3C/svg%3E)
I am using the Chart helper (7-displaying-data-in-a-chart) to build some charts for a report. This report is derived from a survey. At one part of the survey there are some questions that could havee anywhere from 2 to 10 different responses so I can not know at build time what the number is. I have some stored procedures in the datbase that return the pivoted values for the report.
My class reflects the dynamics of this
public class Demographics
{
        public string Xvalue { get; set; }
        public double YValue1 { get; set; }
        public double YValue2 { get; set; }
        public double YValue3 { get; set; }
        public double YValue4 { get; set; }
        public double YValue5 { get; set; }
        public double YValue6 { get; set; }
        public double YValue7 { get; set; }
        public double YValue8 { get; set; }
        public double YValue9 { get; set; }
        public double YValue10 { get; set; }

}
to display the values iIhave the following method in the Demographics class which is then called in my controller
public List<Demographics> GetPivotedDemographics(int GroupNumber, int SurveyNumber, int Demographic, int NumResponses)
{
    using (SqlConnection oConn = new SqlConnection(ConfigurationManager.ConnectionStrings["DefaultConnection"].ConnectionString))
    {
        using (SqlCommand oCmd = new SqlCommand())
        {
            try
            {
                oCmd.CommandText = "PivotedDemographicGroupAverage";
                oCmd.CommandType = CommandType.StoredProcedure;
                oCmd.Parameters.Add("@GroupID", SqlDbType.Int).Value = GroupNumber;
                oCmd.Parameters.Add("@Survey", SqlDbType.Int).Value = SurveyNumber;
                oCmd.Parameters.Add("@Demographic", SqlDbType.Int).Value = Demographic;
                oCmd.Connection = oConn;
                oConn.Open();
                using (var reader = oCmd.ExecuteReader())
                {
                    List<Demographics> myList = new List<Demographics>();
                    while (reader.Read())
                    {
                        Demographics data = new Demographics();
                        switch (NumResponses)
                        {
                            case 3:
                                data.Xvalue = reader[0].ToString();
                                data.YValue1 = Convert.ToDouble(reader[1]);
                                data.YValue2 = Convert.ToDouble(reader[2]);
                                data.YValue3 = Convert.ToDouble(reader[3]);
                                break;
                            case 4:
                                data.Xvalue = reader[0].ToString();
                                data.YValue1 = Convert.ToDouble(reader[1]);
                                data.YValue2 = Convert.ToDouble(reader[2]);
                                data.YValue3 = Convert.ToDouble(reader[3]);
                                data.YValue4 = Convert.ToDouble(reader[4]);
                                break;
                            case 5:
                                data.Xvalue = reader[0].ToString();
                                data.YValue1 = Convert.ToDouble(reader[1]);
                                data.YValue2 = Convert.ToDouble(reader[2]);
                                data.YValue3 = Convert.ToDouble(reader[3]);
                                data.YValue4 = Convert.ToDouble(reader[4]);
                                data.YValue5 = Convert.ToDouble(reader[5]);
                                break;
                            case 6:
                                data.Xvalue = reader[0].ToString();
                                data.YValue1 = Convert.ToDouble(reader[1]);
                                data.YValue2 = Convert.ToDouble(reader[2]);
                                data.YValue3 = Convert.ToDouble(reader[3]);
                                data.YValue4 = Convert.ToDouble(reader[4]);
                                data.YValue5 = Convert.ToDouble(reader[5]);
                                data.YValue6 = Convert.ToDouble(reader[6]);
                                break;
                            case 7:
                                data.Xvalue = reader[0].ToString();
                                data.YValue1 = Convert.ToDouble(reader[1]);
                                data.YValue2 = Convert.ToDouble(reader[2]);
                                data.YValue3 = Convert.ToDouble(reader[3]);
                                data.YValue4 = Convert.ToDouble(reader[4]);
                                data.YValue5 = Convert.ToDouble(reader[5]);
                                data.YValue6 = Convert.ToDouble(reader[6]);
                                data.YValue7 = Convert.ToDouble(reader[7]);
                                break;
                            case 8:
                                data.Xvalue = reader[0].ToString();
                                data.YValue1 = Convert.ToDouble(reader[1]);
                                data.YValue2 = Convert.ToDouble(reader[2]);
                                data.YValue3 = Convert.ToDouble(reader[3]);
                                data.YValue4 = Convert.ToDouble(reader[4]);
                                data.YValue5 = Convert.ToDouble(reader[5]);
                                data.YValue6 = Convert.ToDouble(reader[6]);
                                data.YValue7 = Convert.ToDouble(reader[7]);
                                data.YValue8 = Convert.ToDouble(reader[8]);
                                break;
                            case 9:
                                data.Xvalue = reader[0].ToString();
                                data.YValue1 = Convert.ToDouble(reader[1]);
                                data.YValue2 = Convert.ToDouble(reader[2]);
                                data.YValue3 = Convert.ToDouble(reader[3]);
                                data.YValue4 = Convert.ToDouble(reader[4]);
                                data.YValue5 = Convert.ToDouble(reader[5]);
                                data.YValue6 = Convert.ToDouble(reader[6]);
                                data.YValue7 = Convert.ToDouble(reader[7]);
                                data.YValue8 = Convert.ToDouble(reader[8]);
                                data.YValue9 = Convert.ToDouble(reader[9]);
                                break;
                            case 10:
                                data.Xvalue = reader[0].ToString();
                                data.YValue1 = Convert.ToDouble(reader[1]);
                                data.YValue2 = Convert.ToDouble(reader[2]);
                                data.YValue3 = Convert.ToDouble(reader[3]);
                                data.YValue4 = Convert.ToDouble(reader[4]);
                                data.YValue5 = Convert.ToDouble(reader[5]);
                                data.YValue6 = Convert.ToDouble(reader[6]);
                                data.YValue7 = Convert.ToDouble(reader[7]);
                                data.YValue8 = Convert.ToDouble(reader[8]);
                                data.YValue9 = Convert.ToDouble(reader[9]);
                                data.YValue10 = Convert.ToDouble(reader[10]);
                                break;
                            default:
                                data.Xvalue = reader[0].ToString();
                                data.YValue1 = Convert.ToDouble(reader[1]);
                                data.YValue2 = Convert.ToDouble(reader[2]);
                                break;
                        }
                        myList.Add(data);
                    }
                    return myList;
                }
            }
            finally
            {
                oConn.Close();
                oCmd.Dispose();
            }
        }
    }
}
And my controller code
//Get the number of possible responses for this question
int NumberPossibleResponses = survey.NumberDemographicResponses(Demographic);
//Get the data as a list
 var Group1Data = demo.GetPivotedDemographics(1, SurveyNumber, Demographic, NumberPossibleResponses);

//Build the chart
int c = Group1Data.Count();
ChartHeight = DetermineHeight(c);
FilePathName = "/ChartFiles/" + SurveyNumber.ToString() + "_Demographic_1.jpg";
if (!System.IO.File.Exists(Server.MapPath(FilePathName)))
{
    System.IO.File.Delete(Server.MapPath(FilePathName));
}
var Chart1 = new Chart(width: ChartWidth, height: ChartHeight)
    .AddTitle("Average Answers")
    .DataBindTable(dataSource:Group1Data, xField: "Xvalue")
    //.AddLegend(null,Legend)
    //.AddSeries("Chart1", chartType: "Bar")
    .Save(path: Server.MapPath(FilePathName));
ViewBag.Chart1 = FilePathName;
In the example I am showing there are 4 possible responses being used for the question "how long employed at company"
other examples are
What is your gender?
Which location do you work at?
What department do you work in?
Here is the graph this code creates
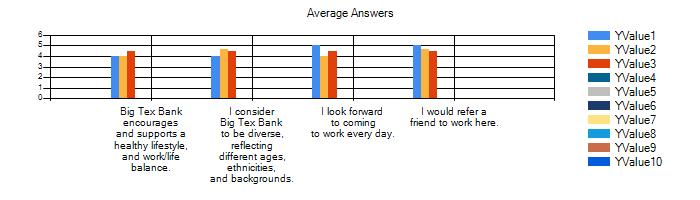
And this is where I am needing some help as I would like to make 2 changes
How do I go about these two things? Any help would be greatly appreciated.
disclaimer this a purely fictional company with a small amount of data used for testing.
' cx='32' cy='32' r='32' /%3E%3Ctext x='50%25' y='55%25' dominant-baseline='middle' text-anchor='middle' fill='%23FFF' %3EYS%3C/text%3E%3C/svg%3E)
Hi @M J
Use a bar chart instead of a column chart
As far as I think,you could use AddSeries() to define the chart's type.
@{
var myChart = new Chart(width: 600, height: 400)
   .AddTitle("Average Answers")
   .AddSeries(chartType:"Bar",
      xValue: Group1Data, xField: "Xvalue",
      yValues: Group1Data, yFields: "Yvalue")
   .Write();
}
Have the legend say what the various colors stand for based on the possible responses
I think you need addlegend() without parameters.
@{
    var myChart = new Chart(width: 600, height: 400)
       .AddTitle("Average Answers")
       .AddLegend()
       .AddSeries(chartType:"Bar",
          xValue: Group1Data, xField: "Xvalue",
          yValues: Group1Data, yFields: "Yvalue")
       .Write();
    }
Best regards,
Yijing Sun
If the answer is the right solution, please click "Accept Answer" and kindly upvote it. If you have extra questions about this answer, please click "Comment".
Note: Please follow the steps in our documentation to enable e-mail notifications if you want to receive the related email notification for this thread.
Because this has a dynamic number of different Yvalues I was unable to use the .AddSeries() method. When I tried what you suggest I get this error message
Series data points do not support values of type CultureAudit.Models.Demographics only values of these types can be used: Double, Decimal, Single, int, long, uint, ulong, String, DateTime, short, ushort.
Which is why I used the .DataBindTable method to bind the data. I tried adding this
var Chart1 = new Chart(width: ChartWidth, height: ChartHeight)
    .AddTitle("Average Answers")
    .DataBindTable(dataSource:Group1Data, xField: "Xvalue")
    .AddLegend()
    .AddSeries("Chart1", chartType: "Bar")
    .Save(path: Server.MapPath(FilePathName));
ViewBag.Chart1 = FilePathName;
and received this error message
Chart Area Axes - The chart area contains incompatible chart types. For example, bar charts and column charts cannot exist in the same chart area.
using the AddLegend() method with no parameters still shows my example
Hi @M J ,
As far as I think,if you use DataBindTable,since it could set the dynamic data,but it can't set the charttype. It's fixed. So,I think,you could use AddSeries().It also could set the dynamic data. According the microsoft article,the xValue's data type and yValues 's data type are IEnumerable, so you could use list as datasource.Just like this:
xValue: xsources,
yValues: ysources
And about the AddLegend(),what do you need?I couldn't understand your description.
Best regards,
Yijing Sun
.DataBindTable() method works but i cannot change the chart type with it.
.AddSeries() method will work but will only show 1 YValue, and in the sample I am testing with there are 4 different y values
this is the error it throws
Data points insertion error. Only 1 Y values can be set for this data series. Parameter name: yFields
For the Legend I would like to be able to change the text. I don't want it to say YValue1, YValue2 etc as that will mean absolutely nothing to the user viewing this.
And to be honest it uses 4 different shades of blue yet has no red, no green, no purple. I would also like to be able to pick the colors used. If there is a way to modify the chart class, I would do that.
Hi @M J ,
Data points insertion error. Only 1 Y values can be set for this data series. Parameter name: yFields
I think you need add yFileds like this:
xValue: data, xField: "Name",
yValues: data, yFields: "Price")
For the Legend I would like to be able to change the text. I don't want it to say YValue1, YValue2 etc as that will mean absolutely nothing to the user viewing this.
And to be honest it uses 4 different shades of blue yet has no red, no green, no purple. I would also like to be able to pick the colors used. If there is a way to modify the chart class, I would do that.
If you need custome the chart,there is a charttheme,and then you could click the chartthemeand press F12,you could find more style of legend.Just like this:
var myChart = new Chart(width: 600, height: 400, theme: ChartTheme.Green)
Best regards,
Yijing Sun
I think you need add yFileds like this:

 xValue: data, xField: "Name",
 yValues: data, yFields: "Price")
If this was not pivoted data then yes that is how I would put in the yFields and that works when it is a SINGLE yField.
When there are multiple YFields for each xField then that does NOT work.
ChartTheme just goes to preset themes that change backlground color, border, gradients etc. From what I can see there is NOTHING that allows for the user to change the colors of the bars/columns when there is multiple yFields. This is pivoted data so there are multiple yFields for each xField and I want to change the colors of those.
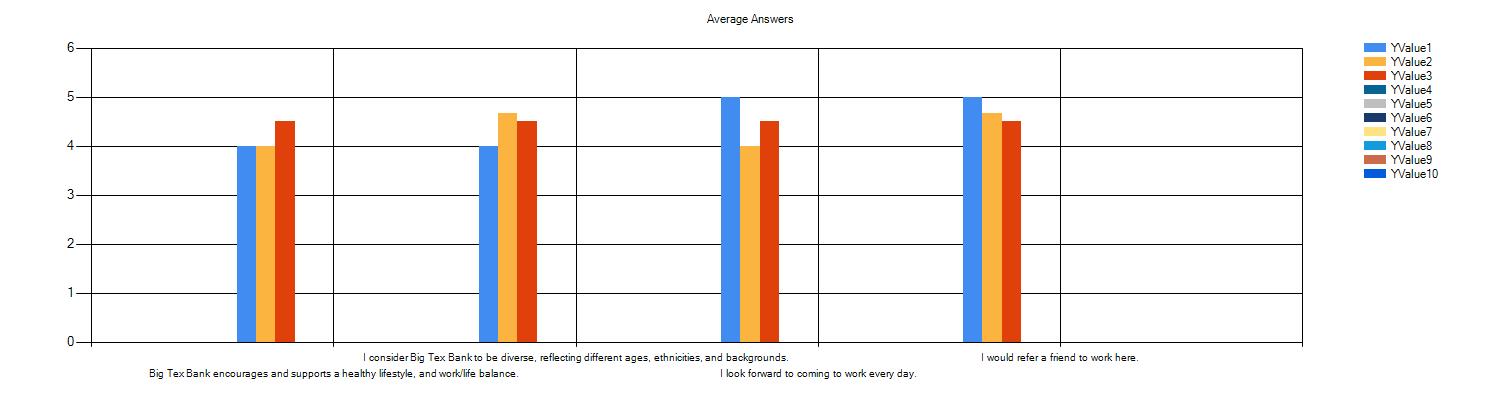
This is the picture in my first post
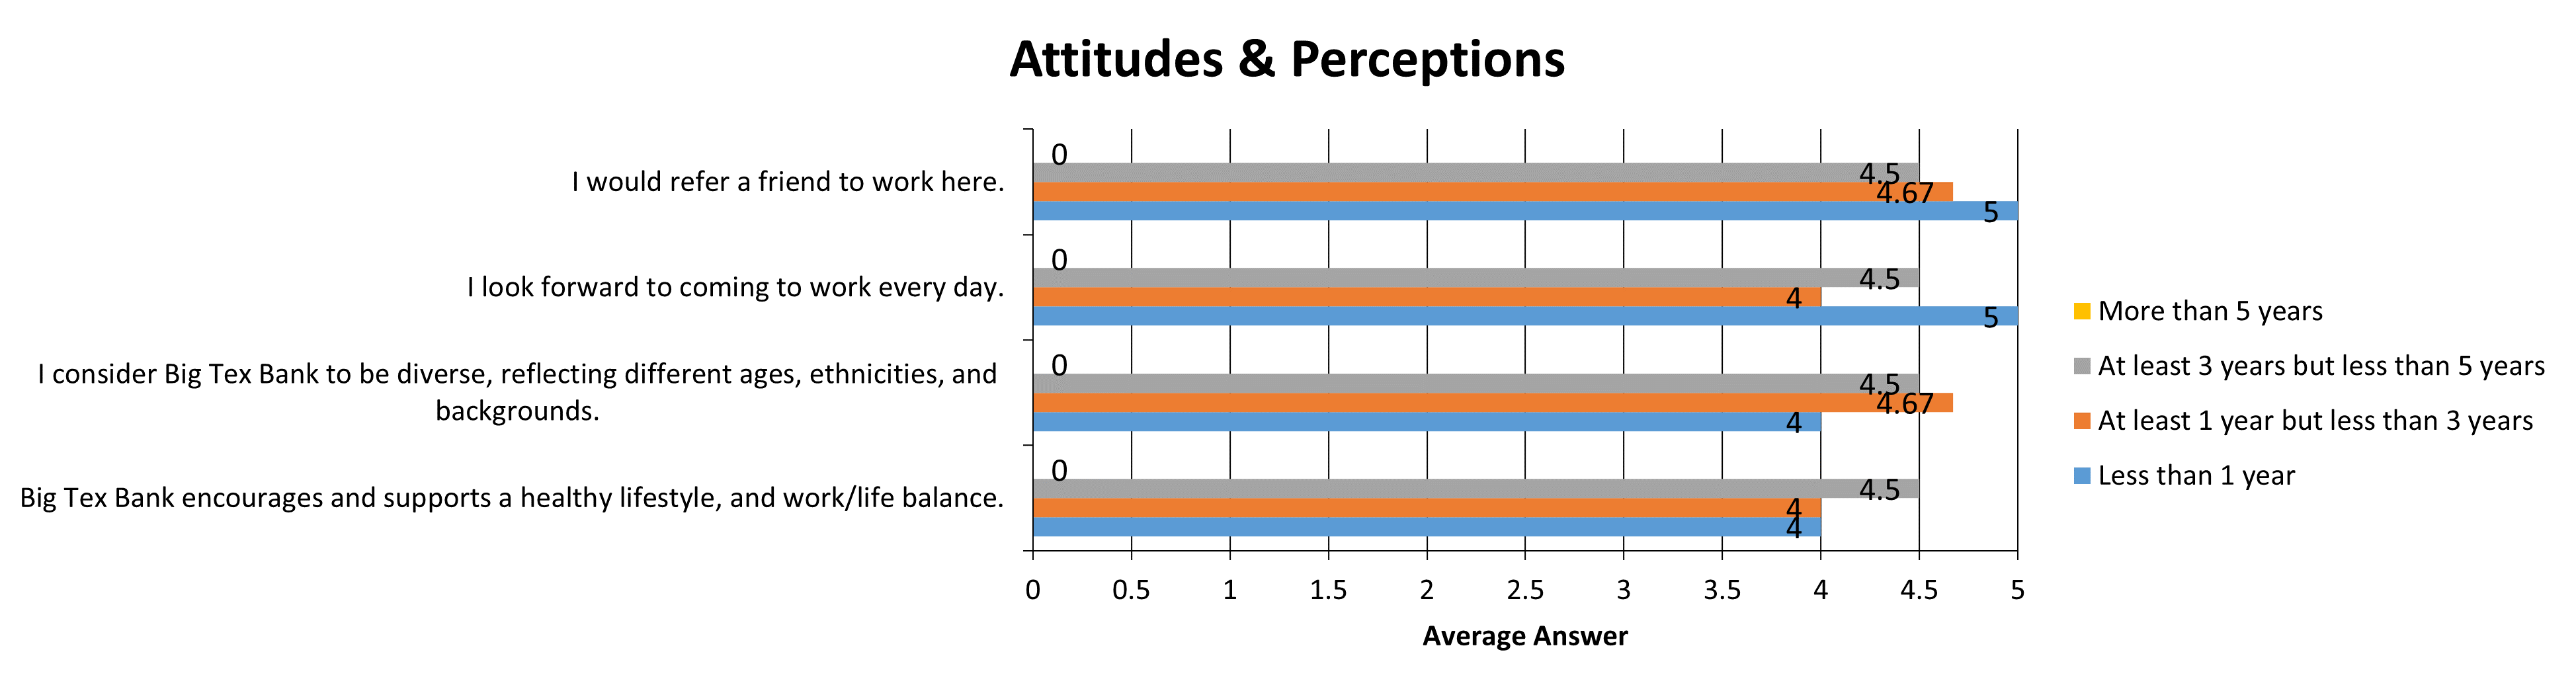
and this is what I am trying to recreate
I can switch to another chart tool if there is a better one to use.
In my further research I too have come to the conclusion that the Chart helper is not a good tool. It can do basics but it is almost as if it was partially developed and then released without being fully developed.
I looked at ChartJS. However, it does the work in the view and I am trying to build the chart in the controller so I can also place the charts into Excel documents and Powerpoint presentations.
I will continue to look for something that can work with those platforms as well as display in the view.
Hi @M J ,
I think,the chart.js also use controller to build the chart with data. And then you could export the chart into the Excel.Just like this:
public ActionResult Chart()
        {
           //Get data from DB, items is list of objects:
           //1. DisplayText - (string) - chart columns names (equals "labels")
           //2. Value - (int) - chart values (equals "data")
           var items = _Layer.GetData().ToList();
           //check if data exists
           if (items.Any())
            {
                string color = "#3c8dbc";
                Dataset ds = new Dataset
                {
                    label = string.Empty,
                    fillColor = color,
                    pointColor = color,
                    strokeColor = color
                };
                var data = items.Select(x => x.Value).ToList();
                ds.data.AddRange(data);
                model.datasets.Add(ds);
                var labels = items.Select(x => x.DisplayText).ToList();
                model.labels = labels;
            }
            var json = JsonConvert.SerializeObject(model, new JsonSerializerSettings() { NullValueHandling = NullValueHandling.Ignore });
            return PartialView("_Chart", json);
        }
Best regards,
Yijing Sun