Physical memory overwhelmed PAL analysis - holy grail found!
I just wrote a very complicated PAL analysis that determines if physical memory is overwhelmed. This analysis takes into consideration the amount of available physical memory and the disk queue length, IO size, and response times of the logical disks hosting the paging files.
Also, if no paging files are configured, then it simply has a warning (1) for less than 10% available physical memory and critical (2) for less than 5% available physical memory.
This analysis (once tested) will be in PAL v2.3.6.
I am making an effort to make this analysis as perfect as I can, so I am open to discussion on this. For example, I might add in if pages/sec is greater than 1 MB, but we have to assume that the disks hosting the paging files are likely servicing non-paging related IO as well. I’m just trying to make it identify that there is *some* paging going on that may or may not be related to the paging files. Also, I am considering adding an increasing trend analysis to this analysis for \Paging File(*)\% Usage, but catching it increasing for a relatively short amount of time is difficult.
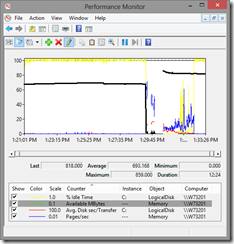
Here is a screenshot of Perfmon with the counters that PAL is analyzing:
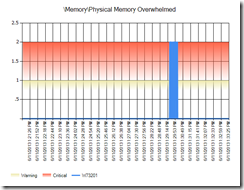
Here is PAL’s simplified analysis…
Memory Physical Memory Overwhelmed
Description: It's complicated.
The physical memory overwhelmed analysis explained…
When the system is low on available physical memory (available refers to the amount of physical memory that can be reused without incurring disk IO), the system will write modified pages (modified pages contain data that is not backed by disk) to disk. The rate at which it writes depends on the pressure on physical memory and the performance of the disk drives.
To determine if a system is incurring system-wide delays due to a low physical memory condition:
- Is \Memory\Available MBytes less than 5% of physical memory? A “yes” does not indicate system-wide delays. If yes, then go to the next step.
- Identify the logical disks hosting paging files by looking at the counter instances of \Paging File(*)\% Usage. Is the usage of paging files increasing? If yes, go to the next step.
- Is there significant hard page faults using \Memory\Pages/sec? Hard page faults might or might not be related to paging files, so this counter alone is not an indicator of a memory problem. A page is 4 KB in size on x86 and x64 Windows and Windows Server, so 1000 hard page faults is 4 MB per second. Most disk drives can handle about 10 MB per second, but we can’t assume that paging is the only consumer of disk IO.
- Are the logical disks hosting the paging files overwhelmed? If the logical disk constantly has outstanding IO requests determined by \LogicalDisk(*)\% Idle Time of less than 10 and if the response time are greater than 15 ms (measured by \LogicalDisk(*)\Avg. Disk sec/Transfer) and if the IO sizes are greater than 64 KB (measured by \LogicalDisk(*)\Avg. Disk Bytes/Transfer), then add 10 ms to the response time threshold.
- As a supplemental indicator, if \Process(_Total)\Working Set is going down in size, then it might indicate that global working set trims are occurring.
- If all of the above is true, then the system’s physical memory is overwhelmed.
I know this is complicated and this is why I created the analysis in PAL (https://pal.codeplex.com) called \Memory\Physical Memory Overwhelmed that takes all of this into consideration and turns it into a simply red, yellow, or green indicator.

