A few thoughts on sizing Audit Collection System
People were already collecting logs with MOM, so why not the security log? Some people were doing that, but it did not scale enough; for this reason, a few years ago Eric Fitzgerald announced that he was working on Microsoft Audit Collection System. Anyhow, the tool as it was had no interface… and the rest is history: it has been integrated into System Center Operations Manager. Anyhow, ACS remains a lesser-known component of OpsMgr.
There are a number of resources on the web that is worth mentioning and linking to:
- SecureVantage ACS Resource Kit https://www.securevantage.com/Products/ACSResourceKit.aspx
- Securevantage has also some very nice online training “Master Classes” https://www.securevantage.com/ACSTraining.aspx
- Old-ish Overview https://opsmgr2007.wikidot.com/system:audit-collection-services
- Old-ish post by kevin https://blogs.technet.com/kevinholman/archive/2008/03/07/acs-internals-part-1.aspx
- ACS Reports for Win2008 https://blogs.technet.com/momteam/archive/2009/05/08/acs-reports-for-windows-2008-and-windows-2008-r2.aspx
- ACS for Cross-Platform https://blogs.msdn.com/scxplat/archive/2009/12/17/cross-platform-audit-collection-services-released.aspx
- Jimmy Harper’s Custom ACS Reports https://blogs.technet.com/jimmyharper/archive/2009/12/10/some-custom-acs-reports.aspx
and, of course, many more, I cannot link them all.
As for myself, I have been playing with ACS since those early beta days (before I joined Microsoft and before going back to MOM, when I was working in Security), but I never really blogged about this piece.
Since I have been doing quite a lot of work around ACS lately, again, I thought it might be worth consolidating some thoughts about it, hence this post.
Anatomy of an “Online” Sizing Calculation
What I would like to explain here is the strategy and process I go thru when analyzing the data stored in a ACS database, in order to determine a filtering strategy: what to keep and what not to keep, by applying a filter on the ACS Collector.
So, the first thing I usually start with is using one of the many “ACS sizer” Excel spreadsheets around… which usually tell you that you need more space than it really is necessary… basically giving you a “worst case” scenario. I don’t know how some people can actually do this from a purely theoretical point of view, but I usually prefer a bottom up approach: I look at the actual data that the ACS is collecting without filters, and start from there for a better/more accurate sizing.
In the case of a new install this is easy – you just turn ACS on, set the retention to a few days (one or two weeks maximum), give the DB plenty of space to make sure it will make it, add all your forwarders… sit back and wait.
Then you come back 2 weeks later and start looking at the data that has been collected.
What/How much data are we collecting?
First of all, if we have not changed the default settings, the grooming and partitioning algorithm will create new partitioned tables every day. So my first step is to see how big each “partition” is.
But… what is a partition, anyway? A partition is a set of 4 tables joint together:
- dtEvent_GUID
- dtEventData_GUID
- dtPrincipal_GUID
- dtSTrings_GUID
where GUID is a new GUID every day, and of course the 4 tables that make up a daily partition will have the same GUID.
The dtPartition table contains a list of all partitions and their GUIDs, together with their start and closing time.
Just to get a rough estimate we can ignore the space used by the last three tables – which are usually very small – and only use the dtEvent_GUID table to get the number of events for that day, and use the stored procedure “sp_spaceused” against that same table to get an overall idea of how much space that day is taking in the database.
By following this process, I come up with something like the following:
| Partition ID | Status | Partition Start Time | Partition Close Time | Rows | Reserved KB | Total GB |
| 9b45a567_c848_4a32_9c35_39b402ea0ee2 | 0 | 2/1/2010 2:00 | 2/1/2010 2:00 | 29,749,366 | 7,663,488 | 7,484 |
| 8d8c8ee1_4c5c_4dea_b6df_82233c52e346 | 2 | 1/31/2010 2:00 | 2/1/2010 2:00 | 28,067,438 | 9,076,904 | 8,864 |
| 34ce995b_689b_46ae_b9d3_c644cfb66e01 | 2 | 1/30/2010 2:00 | 1/31/2010 2:00 | 30,485,110 | 9,857,896 | 9,627 |
| bb7ea5d3_f751_473a_a835_1d1d42683039 | 2 | 1/29/2010 2:00 | 1/30/2010 2:00 | 48,464,952 | 15,670,792 | 15,304 |
| ee262692_beae_4d81_8079_470a54567946 | 2 | 1/28/2010 2:00 | 1/29/2010 2:00 | 48,980,178 | 15,836,416 | 15,465 |
| 7984b5b8_ddea_4e9c_9e51_0ee7a413b4c9 | 2 | 1/27/2010 2:00 | 1/28/2010 2:00 | 51,295,777 | 16,585,408 | 16,197 |
| d93b9f0e_2ec3_4f61_b5e0_b600bbe173d2 | 2 | 1/26/2010 2:00 | 1/27/2010 2:00 | 53,385,239 | 17,262,232 | 16,858 |
| 8ce1b69a_7839_4a05_8785_29fd6bfeda5f | 2 | 1/25/2010 2:00 | 1/26/2010 2:00 | 55,997,546 | 18,105,840 | 17,681 |
| 19aeb336_252d_4099_9a55_81895bfe5860 | 2 | 1/24/2010 2:00 | 1/24/2010 2:00 | 28,525,304 | 7,345,120 | 7,173 |
| 1cf70e01_3465_44dc_9d5c_4f3700dc408a | 2 | 1/23/2010 2:00 | 1/23/2010 2:00 | 26,046,092 | 6,673,472 | 6,517 |
| f5ec207f_158c_47a8_b15f_8aab177a6305 | 2 | 1/22/2010 2:00 | 1/22/2010 2:00 | 47,818,322 | 12,302,208 | 12,014 |
| b48dabe6_a483_4c60_bb4d_93b7d3549b3e | 2 | 1/21/2010 2:00 | 1/21/2010 2:00 | 55,060,150 | 14,155,392 | 13,824 |
| efe66c10_0cf2_4327_adbf_bebb97551c93 | 2 | 1/20/2010 2:00 | 1/20/2010 2:00 | 58,322,217 | 15,029,216 | 14,677 |
| 0231463e_8d50_4a42_a834_baf55e6b4dcd | 2 | 1/19/2010 2:00 | 1/19/2010 2:00 | 61,257,393 | 15,741,248 | 15,372 |
| 510acc08_dc59_482e_a353_bfae1f85e648 | 2 | 1/18/2010 2:00 | 1/18/2010 2:00 | 64,579,122 | 16,612,512 | 16,223 |
If you have just installed ACS and let it run without filters with your agents for a couple of weeks, you should get some numbers like those above for your “couple of weeks” of analysis. If you graph your numbers in Excel (both size and number of rows/events per day) you should get some similar lines that show a pattern or trend:
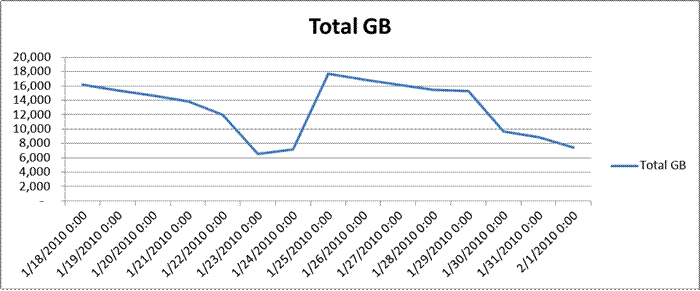
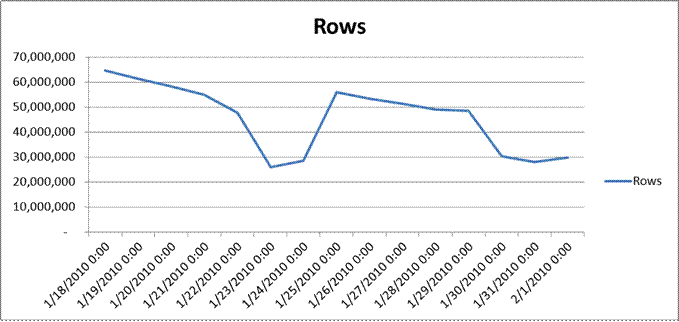
So, in my example above, we can clearly observe a “weekly” pattern (monday-to-friday being busier than the weekend) and we can see that – for that environment – the biggest partition is roughly 17GB. If we round this up to 20GB – and also considering the weekends are much quieter – we can forecast 20*7 = 140GB per week. This has an excess “buffer” which will let the system survive event storms, should they happen. We also always recommend having some free space to allow for re-indexing operations.
In fact, especially when collecting everything without filters, the daily size is a lot less predictable: imagine worms “trying out” administrator account’s passwords, and so on… those things can easily create event storms.
Anyway, in the example above, the customer would have liked to keep 6 MONTHS (180days) of data online, which would become 20*180 = 3600GB = THREE TERABYTE and a HALF! Therefore we need a filtering strategy – and badly – to reduce this size.
[edited on May 7th 2010 - if you want to automate the above analysis and produce a table and graphs like those just shown, you should look at my following post.]
Filtering Strategies
Ok, then we need to look at WHAT actually comprises that amount of events we are collecting without filters. As I wrote above, I usually run queries to get this type of information.
I will not get into HOW TO write a filter here – a collector’s filter is a WMI notification query and it is already described pretty well elsewhere how to configure it.
Here, instead, I want to walk thru the process and the queries I use to understand where the noise comes from and what could be filtered – and get an estimate of how much space we could be saving if filter one way or another.
Number of Events per User
--event count by User (with Percentages)
declare @total float
select @total = count(HeaderUser) from AdtServer.dvHeader
select count(HeaderUser),HeaderUser, cast(convert(float,(count(HeaderUser)) / (convert(float,@total)) * 100) as decimal(10,2))
from AdtServer.dvHeader
group by HeaderUser
order by count(HeaderUser) desc
In our example above, over the 14 days we were observing, we obtained percentages like the following ones:
| #evt | HeaderUser Account | Percent |
| 204,904,332 | SYSTEM | 40.79 % |
| 18,811,139 | LOCAL SERVICE | 3.74 % |
| 14,883,946 | ANONYMOUS LOGON | 2.96 % |
| 10,536,317 | appintrauser | 2.09 % |
| 5,590,434 | mossfarmusr | … |
Just by looking at this, it is pretty clear that filtering out events tracked by the accounts “SYSTEM”, “LOCAL SERVICE” and “ANONYMOUS”, we would save over 45% of the disk space!
Number of Events by EventID
Similarly, we can look at how different Event IDs have different weights on the total amount of events tracked in the database:
--event count by ID (with Percentages)
declare @total float
select @total = count(EventId) from AdtServer.dvHeader
select count(EventId),EventId, cast(convert(float,(count(EventId)) / (convert(float,@total)) * 100) as decimal(10,2))
from AdtServer.dvHeader
group by EventId
order by count(EventId) desc
We would get some similar information here:
| Event ID | Meaning | Sum of events | Percent |
| 538 | A user logged off | 99,494,648 | 27.63 |
| 540 | Successful Network Logon | 97,819,640 | 27.16 |
| 672 | Authentication Ticket Request | 52,281,129 | 14.52 |
| 680 | Account Used for Logon by (Windows 2000) | 35,141,235 | 9.76 |
| 576 | Specified privileges were added to a user's access token. | 26,154,761 | 7.26 |
| 8086 | Custom Application ID | 18,789,599 | 5.21 |
| 673 | Service Ticket Request | 10,641,090 | 2.95 |
| 675 | Pre-Authentication Failed | 7,890,823 | 2.19 |
| 552 | Logon attempt using explicit credentials | 4,143,741 | 1.15 |
| 539 | Logon Failure - Account locked out | 2,383,809 | 0.66 |
| 528 | Successful Logon | 1,764,697 | 0.49 |
Also, do not forget that ACS provides some report to do this type of analysis out of the box, even if for my experience they are generally slower – on large datasets – than the queries provided here. Also, a number of reports have been buggy over time, so I just prefer to run queries and be on the safe side.
Below an example of such report (even if run against a different environment – just in case you were wondering why the numbers were not the same ones :-)):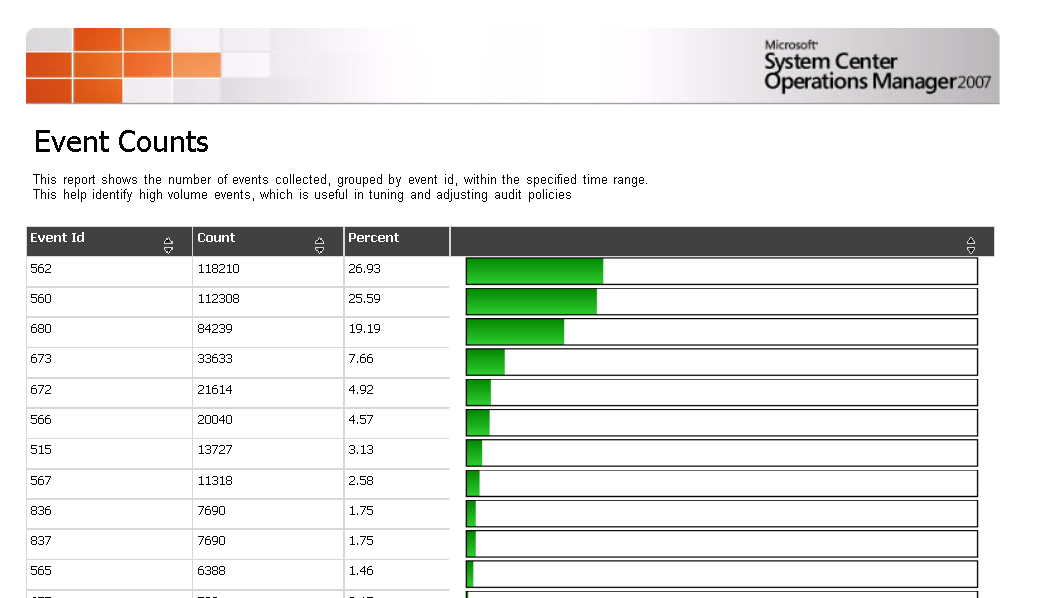
The numbers and percentages we got from the two queries above should already point us in the right direction about what we might want to adjust in either our auditing policy directly on Windows and/or decide if there is something we want to filter out at the collector level (here you should ask yourself the question: “if they aren’t worth collecting are they worth generating?” – but I digress).
Also, a permutation of the above two queries should let you see which user is generating the most “noise” in regards to some events and not other ones… for example:
--event distribution for a specific user (change the @user) - with percentages for the user and compared with the total #events in the DB
declare @user varchar(255)
set @user = 'SYSTEM'
declare @total float
select @total = count(Id) from AdtServer.dvHeader
declare @totalforuser float
select @totalforuser = count(Id) from AdtServer.dvHeader where HeaderUser = @user
select count(Id), EventID, cast(convert(float,(count(Id)) / convert(float,@totalforuser) * 100) as decimal(10,2)) as PercentageForUser, cast(convert(float,(count(Id)) / (convert(float,@total)) * 100) as decimal(10,2)) as PercentageTotal
from AdtServer.dvHeader
where HeaderUser = @user
group by EventID
order by count(Id) desc
The above is particularly important, as we might want to filter out a number of events for the SYSTEM account (i.e. logons that occur when starting and stopping services) but we might want to keep other events that are tracked by the SYSTEM account too, such as an administrator having wiped the Security Log clean – which might be something you want to keep:
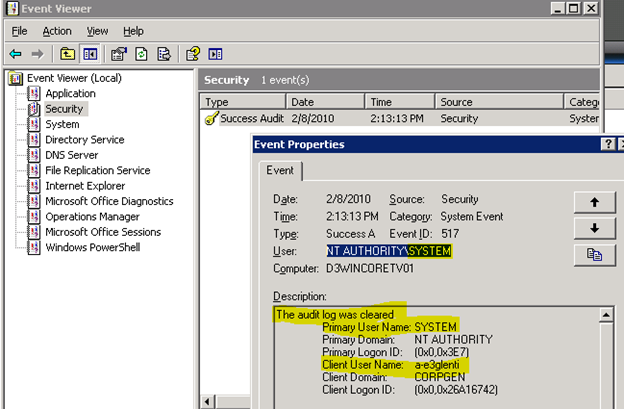
of course the amount of EventIDs 517 over the total of events tracked by the SYSTEM account will not be as many, and we can still filter the other ones out.
Number of Events by EventID and by User
We could also combine the two approaches above – by EventID and by User:
select count(Id),HeaderUser, EventId
from AdtServer.dvHeader
group by HeaderUser, EventId
order by count(Id) desc
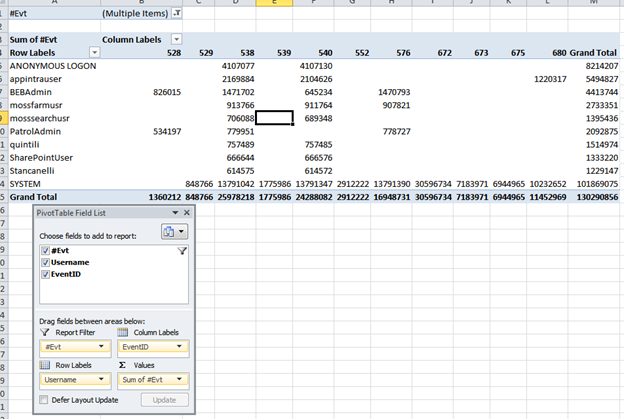
This will produce a table like the following one
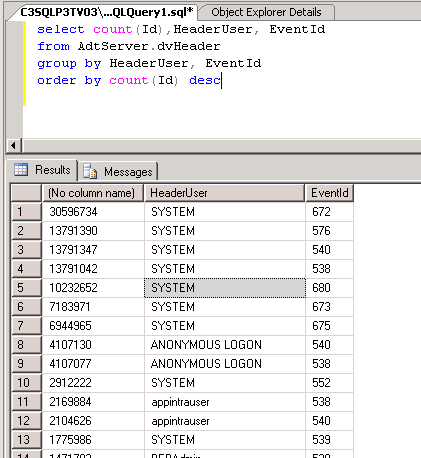
which can be easily copied/pasted into Excel in order to produce a pivot Table:
Cluster EventLog Replication
One more aspect that is less widely known, but I think is worth showing, is the way that clusters behave when in ACS. I don’t mean all clusters… but if you keep the “eventlog replication” feature of clusters enabled (you should disable it also from a monitoring perspective, but I digress), each cluster node’s security eventlog will have events not just for itself, but for all other nodes as well.
Albeit I have not found a reliable way to filter out – other than disabling eventlog replication altogether.
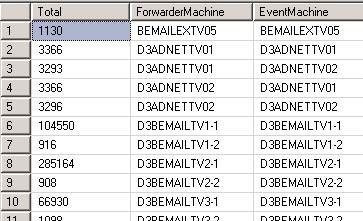
Anyway, just to get an idea of how much this type of “duplicate” events weights on the total, I use the following query, that tells you how many events for each machine are tracked by another machine:
--to spot machines that are cluster nodes with eventlog repliation and write duplicate events (slow)
select Count(Id) as Total,replace(right(AgentMachine, (len(AgentMachine) - patindex('%\%',AgentMachine))),'$','') as ForwarderMachine, EventMachine
from AdtServer.dvHeader
--where ForwarderMachine <> EventMachine
group by EventMachine,replace(right(AgentMachine, (len(AgentMachine) - patindex('%\%',AgentMachine))),'$','')
order by ForwarderMachine,EventMachine
Those presented above are just some of the approaches I usually look into at first. Of course there are a number more. Here I am including the same queries already shown in action, plus a few more that can be useful in this process.
I have even considered building a page with all these queries – a bit like those that Kevin is collecting for OpsMgr (we actually wrote some of them together when building the OpsMgr Health Check)… shall I move the below queries on such a page? I though I’d list them here and give some background on how I normally use them, to start off with.
Some more Useful Queries
--top event ids
select count(EventId), EventId
from AdtServer.dvHeader
group by EventId
order by count(EventId) desc
--event count by ID (with Percentages)
declare @total float
select @total = count(EventId) from AdtServer.dvHeader
select count(EventId),EventId, cast(convert(float,(count(EventId)) / (convert(float,@total)) * 100) as decimal(10,2))
from AdtServer.dvHeader
group by EventId
order by count(EventId) desc
--which machines have ever written event 538
select distinct EventMachine, count(EventId) as total
from AdtServer.dvHeader
where EventID = 538
group by EventMachine
--machines
select * from dtMachine
--machines (more readable)
select replace(right(Description, (len(Description) - patindex('%\%',Description))),'$','')
from dtMachine
--events by machine
select count(EventMachine), EventMachine
from AdtServer.dvHeader
group by EventMachine
--rows where EventMachine field not available (typically events written by ACS itself for chekpointing)
select *
from AdtServer.dvHeader
where EventMachine = 'n/a'
--event count by day
select convert(varchar(20), CreationTime, 102) as Date, count(EventMachine) as total
from AdtServer.dvHeader
group by convert(varchar(20), CreationTime, 102)
order by convert(varchar(20), CreationTime, 102)
--event count by day and by machine
select convert(varchar(20), CreationTime, 102) as Date, EventMachine, count(EventMachine) as total
from AdtServer.dvHeader
group by EventMachine, convert(varchar(20), CreationTime, 102)
order by convert(varchar(20), CreationTime, 102)
--event count by machine and by date (distinuishes between AgentMachine and EventMachine
select convert(varchar(10),CreationTime,102),Count(Id),EventMachine,AgentMachine
from AdtServer.dvHeader
group by convert(varchar(10),CreationTime,102),EventMachine,AgentMachine
order by convert(varchar(10),CreationTime,102) desc ,EventMachine
--event count by User
select count(Id),HeaderUser
from AdtServer.dvHeader
group by HeaderUser
order by count(Id) desc
--event count by User (with Percentages)
declare @total float
select @total = count(HeaderUser) from AdtServer.dvHeader
select count(HeaderUser),HeaderUser, cast(convert(float,(count(HeaderUser)) / (convert(float,@total)) * 100) as decimal(10,2))
from AdtServer.dvHeader
group by HeaderUser
order by count(HeaderUser) desc
--event distribution for a specific user (change the @user) - with percentages for the user and compared with the total #events in the DB
declare @user varchar(255)
set @user = 'SYSTEM'
declare @total float
select @total = count(Id) from AdtServer.dvHeader
declare @totalforuser float
select @totalforuser = count(Id) from AdtServer.dvHeader where HeaderUser = @user
select count(Id), EventID, cast(convert(float,(count(Id)) / convert(float,@totalforuser) * 100) as decimal(10,2)) as PercentageForUser, cast(convert(float,(count(Id)) / (convert(float,@total)) * 100) as decimal(10,2)) as PercentageTotal
from AdtServer.dvHeader
where HeaderUser = @user
group by EventID
order by count(Id) desc
--to spot machines that write duplicate events (such as cluster nodes with eventlog replication enabled)
select Count(Id),EventMachine,AgentMachine
from AdtServer.dvHeader
group by EventMachine,AgentMachine
order by EventMachine
--to spot machines that are cluster nodes with eventlog repliation and write duplicate events (better but slower)
select Count(Id) as Total,replace(right(AgentMachine, (len(AgentMachine) - patindex('%\%',AgentMachine))),'$','') as ForwarderMachine, EventMachine
from AdtServer.dvHeader
--where ForwarderMachine <> EventMachine
group by EventMachine,replace(right(AgentMachine, (len(AgentMachine) - patindex('%\%',AgentMachine))),'$','')
order by ForwarderMachine,EventMachine
--which user and from which machine is target of elevation (network service doing "runas" is a 552 event)
select count(Id),EventMachine, TargetUser
from AdtServer.dvHeader
where HeaderUser = 'NETWORK SERVICE'
and EventID = 552
group by EventMachine, TargetUser
order by count(Id) desc
--by hour, minute and user
--(change the timestamp)... this query is useful to search which users are active in a given time period...
--helpful to spot "peaks" of activities such as password brute force attacks, or other activities limited in time.
select datepart(hour,CreationTime) as Hours, datepart(minute,CreationTime) as Minutes, HeaderUser, count(Id) as total
from AdtServer.dvHeader
where CreationTime < '2010-02-22T16:00:00.000'
and CreationTime > '2010-02-22T15:00:00.000'
group by datepart(hour,CreationTime), datepart(minute,CreationTime),HeaderUser
order by datepart(hour,CreationTime), datepart(minute,CreationTime),HeaderUser