How to Monitor for Storage Account Throttling
For Azure Virtual Machines, we document storage limits of 500 IOPS per disk, and the guidance to not place more than 40 highly used VHDs in any single storage account since there is a 20,000 IOPS limit per storage account.
By default, each subscription can have up to 20 storage accounts containing up to 500 TB each. The limit of 20 storage accounts per subscription can be increased to up to 50 by contacting Microsoft support.
The risk of storage account throttling having a negative performance impact on your VMs exists once you have more than 40 highly used disks in a single storage account. And with more than 40 disks in a single storage account, each disk wouldn't need to be hitting the 500 IOPS limit for the entire storage account to be hitting the 20,000 IOPS limit.
Determining the Number of Disks in a Storage Account
You can get a count of disks per storage account manually by looking in the portal under Virtual Machines, then select Disks. Disks in the same storage account will have the same first label of the DNS name under the Location column. For example, the location of https://clnorthcentralusstorage.blob.core.windows.net/... indicates the disk resides in the storage account named clnorthcentralusstorage.
A simpler way to get a count of disks per storage account is with Azure PowerShell using the Get-AzureDisk cmdlet. In the example below, the clnorthcentralusstorage account has 46 disks. If all of those disks were highly utilized at the same time, the storage account would be at risk for being throttled due to the 20,000 IOPS limit for a single storage account, and some of the disks would see performance lower than the 500 IOPS per-disk limit.
Get-AzureDisk | Where-Object { $_.AttachedTo } | Group-Object {$_.Medialink.Host.Split('.')[0]} –NoElement
 Count Name
----- ----
 46 clnorthcentralusstorage
Monitoring for Storage Account Throttling
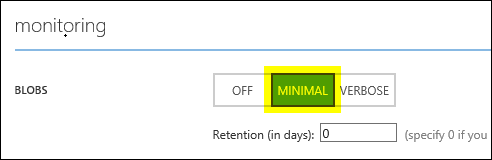
To monitor for storage account throttling, in the Azure management portal, select Storage on the left, select the storage account you want to monitor on the right, the select the Configure tab and under the Monitoring section , change Blobs from Off to Minimal (Verbose will work also, but is not necessary to monitor just for storage account throttling).
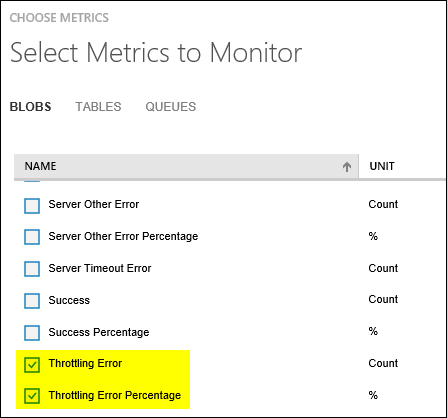
Now switch to the Monitoring tab, select Add Metrics at the bottom of the page, and under Select Metrics to Monitor, select Throttling Error and Throttling Error Percentage, then click OK.
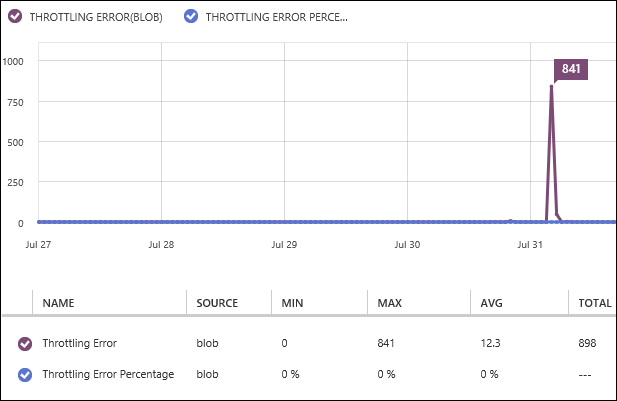
Now you can view minimum, maximum, average, and total values for those metrics for either 6-hour, 24-hour, or 7-day timeframes.
Additionally you can configure alerts to get email notification when those metrics hit a defined threshold.
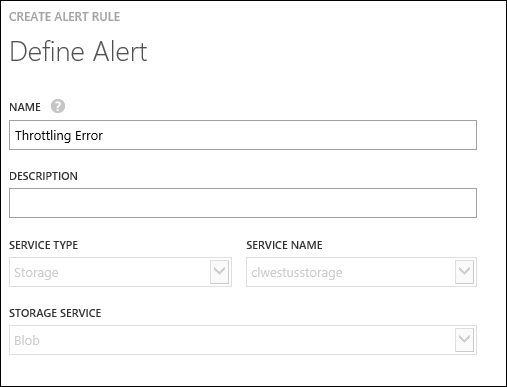
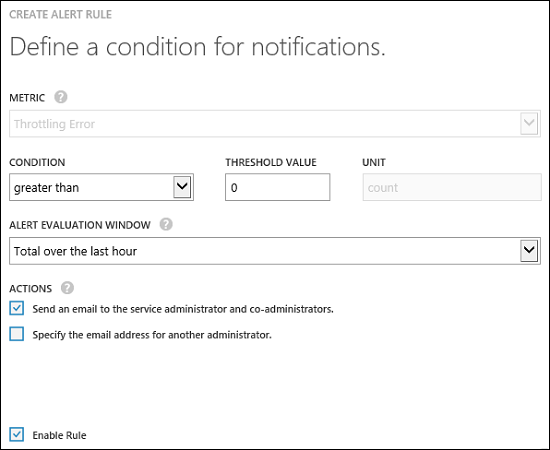
To configure an alert, on the Monitor tab for a storage account, select the metric you want to alert on, then click Add Rule at the bottom of the page. Provide a display name for the alert rule, and then define the alert threshold.
Make sure to select Send an email to the service administrator and co-administrators so you are notified via email when the alert threshold is hit. Additionally, you can select Specify the email address for another administrator if you want to send to an email address other than one for the service admin and co-admins for the subscription.
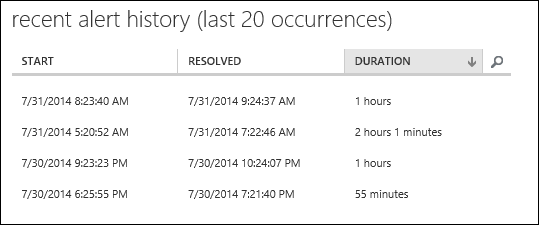
Once the rule is created, you can click through on 1 rule configured on the far right column, or go to Management Services in the left navigation pane of the portal and select Alert, then select the rule to view the alert details and recent alert history (last 20 occurrences) .
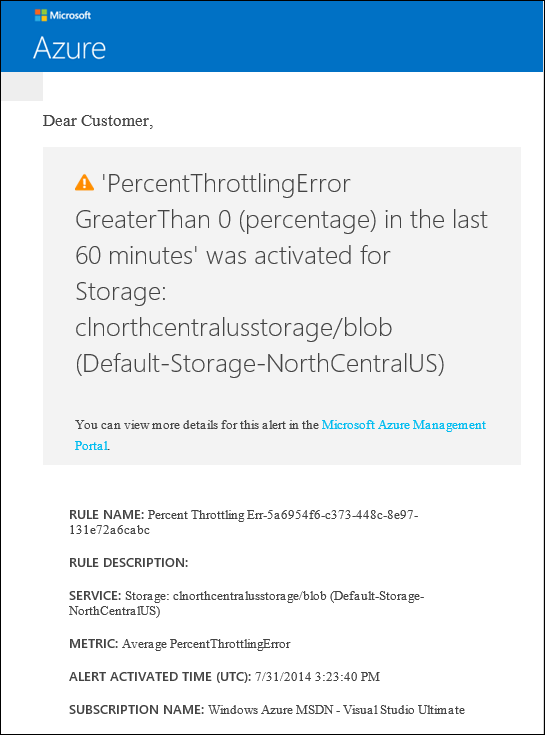
When the metric hits the defined threshold and triggers the alert, if email notification is enabled on the alert, you will get an email with a subject line similar to this:
[ALERT ACTIVATED] - PercentThrottlingError GreaterThan 0 (percentage) in the last 60 minutes
And when the metric falls below the threshold, you will get an email indicating the alert was resolved:
[ALERT RESOLVED] - PercentThrottlingError GreaterThan 0 (percentage) in the last 60 minutes
Here is an example of the mail when an alert is activated:
More Information
- Azure Subscription and Service Limits, Quotas, and Constraints
- Create Alert Rule (API reference for programmatic creation of alert rules)
- SOSP Paper - Windows Azure Storage: A Highly Available Cloud Storage Service with Strong Consistency
- Performance Best Practices for SQL Server in Azure Virtual Machines
- Virtual Machine and Cloud Service Sizes for Azure