PDC10: Mysteries of Windows Memory Management Revealed: Part One
Fundamentals of Memory Management
Windows has both physical and virtual memory. Memory is managed in pages, with processes demanding it as necessary. Memory pages are 4KB in size (both for physical and virtual memory); but you can also allocate memory in large (2-4MB, depending on architecture) pages for efficiency. In general, there are very few things in common between physical and virtual memory, as we’ll see.
On 32-bit (x86) architectures, the total addressable memory is 4GB (232 bytes), divided equally into user space and system space. Pages in system space can only be accessed from kernel mode; user-mode processes (application code) can only access data that is appropriately marked in user mode. There is one single 2GB system space that is mapped into the address space for all processes; each process also has its own 2GB user space. (You can adjust the split to 3GB user / 1GB system on PAE-enabled systems, but the 4GB overall address space limit remains.)
With a 64-bit architecture, the total address space is theoretically 264 = 16EB, but for a variety of software and hardware architectural reasons, 64-bit Windows only supports 244 = 16TB today, split equally between user and system space. Mark: “I think I’m pretty safe in saying that we’ll never need more than 16TB, but people smarter than me have been proven wrong with statements like that, so I’m not sure if I should make that claim or not!”
Virtual Memory
Within a process, virtual memory is broken into three categories: (i) private virtual memory – that which is not shared – e.g. the process heap; (ii) shareable – memory mapped files or space that you’ve explicitly chosen to share; (iii) free – memory with an as yet undefined use. Private and shareable memory can also be flagged in two ways: reserved (a thread has plans to use this range but it isn’t available yet), and committed (available to use). Why should you reserve memory? It allows an application to lazily commit contiguous memory. For example, a stack: the system only needs to commit a small amount in advance, and can grow as appropriate by committing previously-reserved memory.
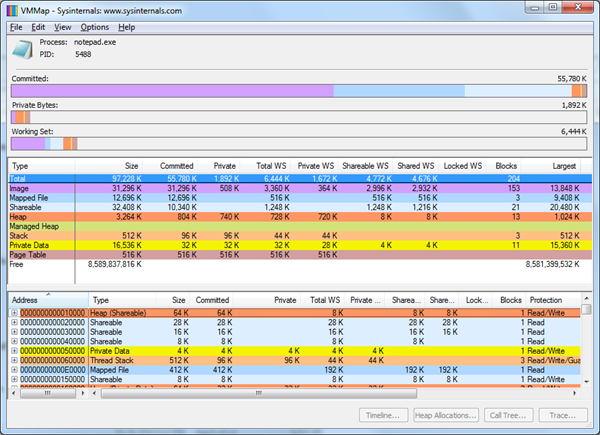
Task Manager only lets you see the private bytes (“commit size”); indeed, most virtual memory problems are due to a process leaking private committed memory, since it backs the various heaps in the system. But this doesn’t offer a full view of the address space – it doesn’t account for shareable memory that isn’t shared (e.g. a DLL only loaded by this process). Fragmentation can also be an issue, causing the address space to be exhausted prematurely. Process Explorer lets you split out the overall virtual memory used by a process from the private bytes; another useful tool is VMMap (with a new v3.0 released for PDC10), which provides a really deep level of inspection into the virtual memory used by a given process.
In the example above, the committed memory is about 54MB, but only a tiny amount is private. The middle section shows how the memory is allocated – images (DLLs and executables), mapped files, shared sections, heaps (unmanaged and managed), the stack region, private data (memory that is private and doesn’t fall into one of the other categories, e.g. if you call VirtualAlloc()), and page tables. If you click on one of these rows, you’ll filter the details section at the bottom of the window.
Fragmentation can be an issue, as mentioned earlier. Mark demonstrated creating a large number of threads with testlimit –t. The number of threads he was able to create on a 32-bit machine was limited to ~2900 even though in theory he should have been able to create more, because the address space was so fragmented that there were no more contiguous spaces of 1MB or more (1MB being the default size).
Mapped Files
Mark then demonstrated how mapped files are used heavily by Explorer. Files are mapped regularly so that it can get access to the resources and metadata from within them. You can trace file mappings with Process Monitor – so if you don’t understand why a file is mapped, you can see how the DLL got loaded by capturing a snapshot filtered to “Load Image” operations and examining the stack at the point the image was loaded.
You can also use VMMap to compare the difference between two snapshots of a process. In the given example of loading a file into Notepad, the committed memory grew from the 54MB above to over 100MB – with most of it coming from image loading.
New in VMMap 3.0 is tracing, which enables you to launch a process with profiling and track virtual and heap activity over a period of time.
System Commit Limit and Paging Files
Certain kinds of process committed memory are charged against the system commit limit. System committed memory is that which is backed either by the paging file or physical memory. Not all memory in the address space is system committed memory – for example, the notepad.exe image or its DLLs are backed by disk, so if the system tossed out of memory and Notepad wanted to access it again, it could simply retrieve it from notepad.exe on disk.
 When Windows needs to reallocate private memory, it has to store it in the paging file (otherwise it would be missing when it needed to retrieve it). When that limit is reached, you’ve run out of virtual memory. You can increase the system commit limit by adding RAM or increasing the paging file size: if paging files are configured to expand, that means that the system commit limit may not actually be the maximum limit.
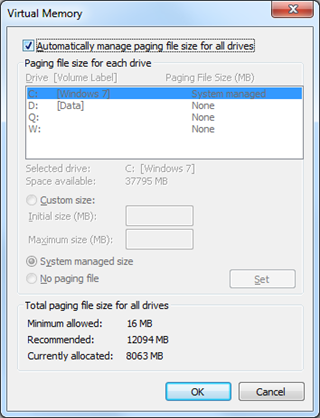
So how is the paging file size determined? By default, it is automatically managed by Windows based on the RAM available: on systems with >1GB RAM, the minimum is equal to the size of the RAM and the maximum is 3x RAM or 4GB (whichever is larger). You can manually adjust this, however.
What’s ironic about this algorithm is that in the dialog, the recommended value is often a completely different number (on my 8GB machine, it’s 1.4x RAM), which as Mark notes fails to inspire confidence in the algorithm.
You can view system commit charge and limit from Task Manager or Process Explorer; you can test exhausting the system commit limit by running testlimit –m. (Be careful – this will stress your machine to its limit!)
So how should you size your paging file? Many people will give you advice based in multiples of the RAM, but that isn’t good advice. You should look at the system commit peak for the most extreme workload and if you want to apply a multiplication factor (1.5x, 2x), apply it to that value instead. Note that it’s important to ensure that the paging file is big enough to hold a kernel crash dump. Although you can turn off the paging file altogether, it is useful – the system can page out unused, modified private pages, providing more RAM for real workloads.
[Session CD01 | presented by Mark Russinovich]
