Using Query APIs to Unlock the Power of Azure Time Series Insights
 By Basim Majeed, Cloud Solution Architect at Microsoft
Azure Time Series Insights (TSI) is a fully managed service aimed at providing visual analytics capabilities for time series data, and an important building block for a new breed of IoT solutions. Most of the exposure to TSI up to now has been through users interacting with the pre-configured TSI Explorer.
However, TSI is more than just one application for data exploration but a highly performant database with rich query APIs. Custom IoT solutions can be easily developed once the power of these APIs is unlocked. This blog is the first of a series that will attempt to bring clarity to the power of these APIs through the use of varied examples. We will show how to examine these query APIs through the use of Postman, which is a tool that simplifies the development and exploration of APIs.
There is comprehensive documentation for the TSI query APIs and Query Syntax. Here we are trying to bring these APIs to life using practical examples that show the link with the rest of Microsoft Azure IoT components. A typical IoT architecture involving the TSI service is shown in Figure 1.
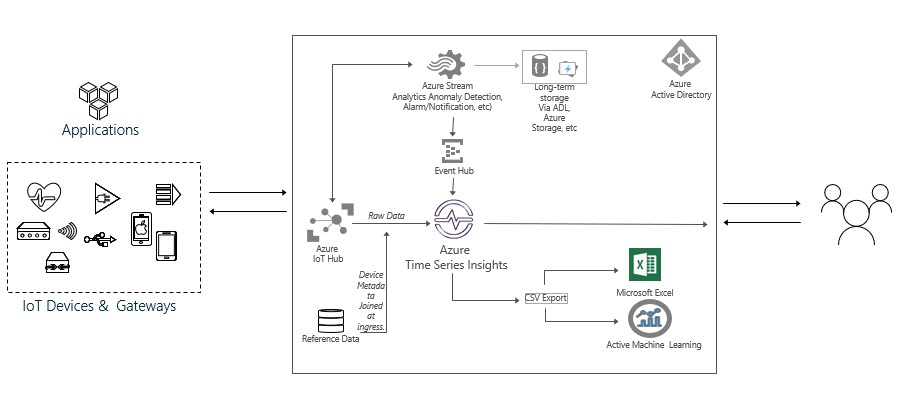
Figure 1: A typical IoT Architecture built with Azure Services
To start we need to set up a number of pre-requisites which we will cover in the first section.
Section 1: Pre-requisites
These pre-requisites are briefly described here to help the reader create an environment for practicing with TSI query APIs. If you just want to learn about the examples themselves head straight to the query examples in section 2 after reading point 3 below, in which we talk about the simulated sensors we use in the examples.
1. Provision the TSI environment in Azure
Follow the steps in Azure TSI Documentation to provision an environment. We need to make a note of the TSI environment's FQDN, which we can get from the Azure Portal. We go the TSI environment and copy the “Data Access FQDN”, which looks something like this:
*****.env.timeseries.azure.com
2. Provision an Azure IoT Hub and connect it to the TSI environment
To achieve this, follow the steps here.
3. Create Simulated devices and connect them to the Azure IoT Hub
If you do not have real devices that send telemetry to the IoT Hub then use the sample code to create simulated devices in a number of development languages.
In the example we are using here, the message sent by the simulated device is of the following JSON format
{"tag":"Pres_22","telemetry":"Pressure","value":12.02848,"factory":"Factory_2","station":"Station_2"}
The data represents a simple industrial environment with 2 factories, 2 stations per factory and 2 sensors for each station measuring Temperature and Pressure. For simplicity, all the data is channelled through one IoT device (iotDevice_1) connected to the to the IoT Hub, or you might want to have many devices connected directly to the Hub.
4. Set up authentication to access the TSI data
In order for an application to query the TSI data, we need to set up an Azure Active Directory (AAD) application and assign the data access policies in the Time Series Insights environment as described here. If you want to replicate the steps below then make a note of the Application ID and Application Secret so that you can use them to allow Postman to query the TSI data. You also need to get the OAuth 2.0 Token Endpoint by going to the “App registrations” tab in AAD then selecting the “Endpoints” tab.
5. Set up Postman to run the queries
You can set up variables within Postman and use them in the queries to reduce repetition. For example, we have set up two variables to define the time period over which the queries will run on the TSI data. You can define these at the environment level in Postman as shown in Figure 2.
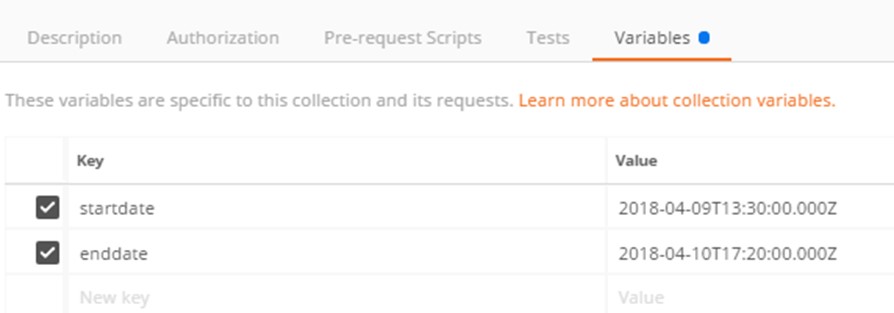
Figure 2: Setting up the query time span variables in Postman
6. Obtain the access token from Azure Active Directory
In this step we run a POST request to the AAD outh2 endpoint which we got in step 4. Here we need to provide the client_id and client_secret (from step 4) in the body of the request as shown in Figure 3.
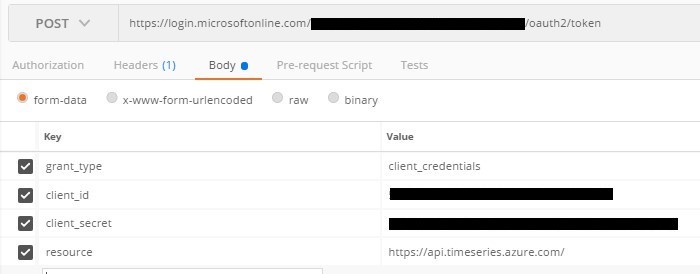
Figure 3: Post request to obtain the access token
The result will contain the access token, plus other related properties like expiry information as shown in Figure 4. We need to copy this token and use it in the TSI data queries. Note that the token will need to be refreshed regularly.
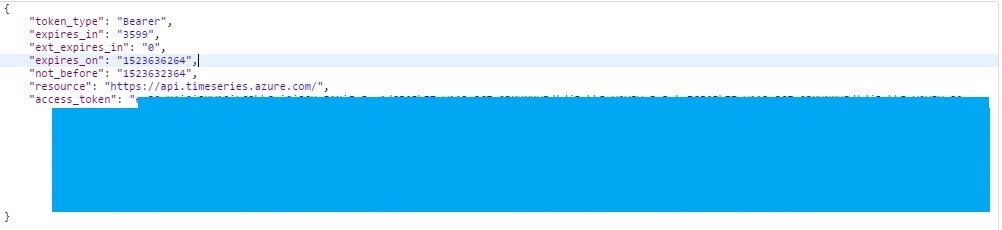
Figure 4: The access token
Section 2: Query Examples
1. Explore the metadata of the events stored in the TSI environment
The following request can be used to get the schema of the data. The DataAccessFQDN of the TSI environment is obtained in step 1 of the pre-requests section above.
POST https://<DataAccessFQDN>/metadata?api-version=2016-12-12
The body of the command contains the time span for the query using the start and end dates set in step 5 of the pre-requisites section:
 {
    "searchSpan": {
        "from": {"dateTime":"{{startdate}}"},
        "to": {"dateTime":"{{enddate}}"}
    }
}
Figure 5 shows how to set the header of the metadata query request with the access token.
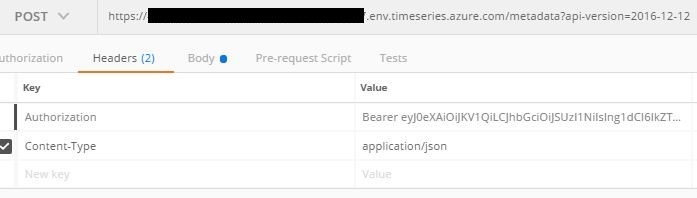
Figure 5: The header of the Metadata query request
If successful, the query returns the schema shown in Figure 6, which in addition to the five elements contained in our device message to the cloud, contains additional elements inserted by the IoT Hub.
The first interesting point we should notice here is that the TSI has ingested the "iothub-connection-auth-generation-id" as both Double and String. This is a characteristic of how TSI generates the schema for the ingested data; if a value fits into two of the 4 main data types then TSI will generate both entries, in this case String and Double.
The second point we need to note is that all the extra data added to the events by the IoT Hub will affect how much storage is available for any new events. If we want to remove this extra data then one way is to use a combination of Azure Stream Analytics and Event Hub after the IoT Hub. The Stream Analytics component can be set to remove any unwanted data, while the event hub would be the point of insertion of data to the TSI environment.
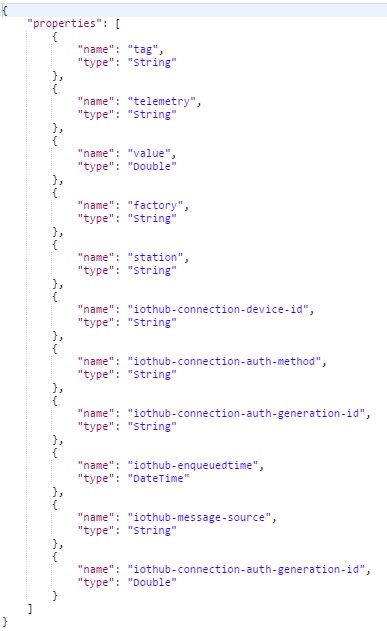
Figure 6: The data schema
2. Get a number of events that satisfy a specific condition (predicate), sorted by their time stamp
In the following request we specify a predicate and get the data that satisfy the predicate. The POST request is directed to the “events” resource path
POST https://<DataAccessFQDN>/events?api-version=2016-12-12
The predicate consists of two equality comparisons combined by the “and” operator. The results will be all the events that satisfy both factory = “Factory_1” and station = “Station_1” property values. These results are then sorted by the built-in property "$ts" which is the time stamp for the data ingestion by the TSI (taken by default from the IoT Hub enqueued time of the event). The top 10 events are returned in this example.
 {
    "searchSpan": {
      "from": { "dateTime":"{{startdate}}" },
      "to": { "dateTime":"{{enddate}}" }
    },
    "predicate":{
      "and":[
        {
          "eq": {
            "left": {
              "property": "factory",
              "type": "String"
            },
            "right": "Factory_1"
          }
        },
        {
           "eq": {
             "left": {
               "property": "station",
               "type": "String"
             },
             "right": "Station_1"
          }
        }
    ]
},
"top" : {
  "sort" : [{
    "input": {
      "builtInProperty": "$ts"
    },
    "order": "Asc"
  }],
    "count" : 10
  }
}
Figure 7 shows a part of the results returned by the query.
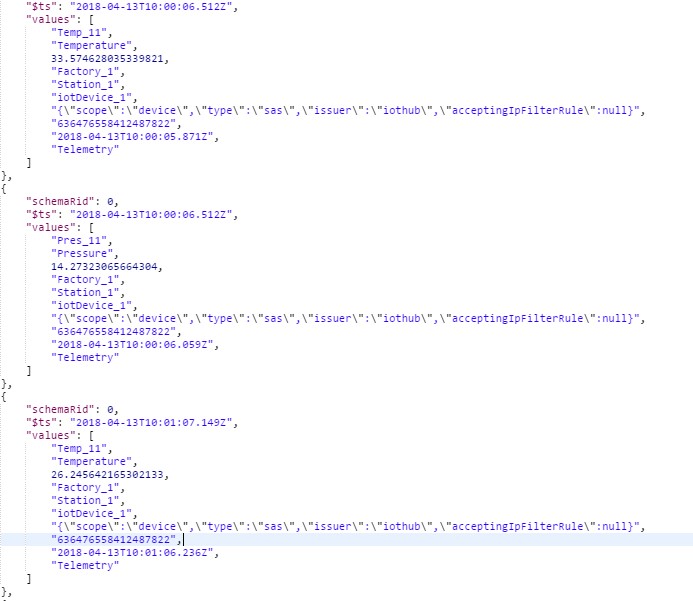
Figure 7: Events query results
Conclusion
We have shown how easy it is to get started with Azure Time Series Insights and demonstrated some of the basic query patterns that can be used to customise the service. In the next part of this blog series we will look at more advanced query examples using the aggregation query patterns.
---
Be sure to check out part 2! Basim takes a look at the Aggregates API, which provides the capability to group events by a given dimension and to measure the values of other properties using aggregate expressions.