Using Spark on Azure - Part 2 - Enter Power BI
As you have seen in Part 1 it is very easy to create a powerful Spark cluster and get some great data exploration capabilities right in the Zeppelin notebooks. But at one point you may want to visualize your data so you can share it with your colleagues. Power BI is an incredibly rich solution not only allowing you to connect to files, services and databases but also Big Data systems like Spark. Because certain systems like Azure SQL Data Warehouse, SQL Server Analysis Services and Spark provide great performance we also allow you to connect directly to these data sources, skipping the in-memory modeling work and just passing through the queries directly to the source.
So how easy is it to connect to a Spark cluster running on Azure? Let's find out!
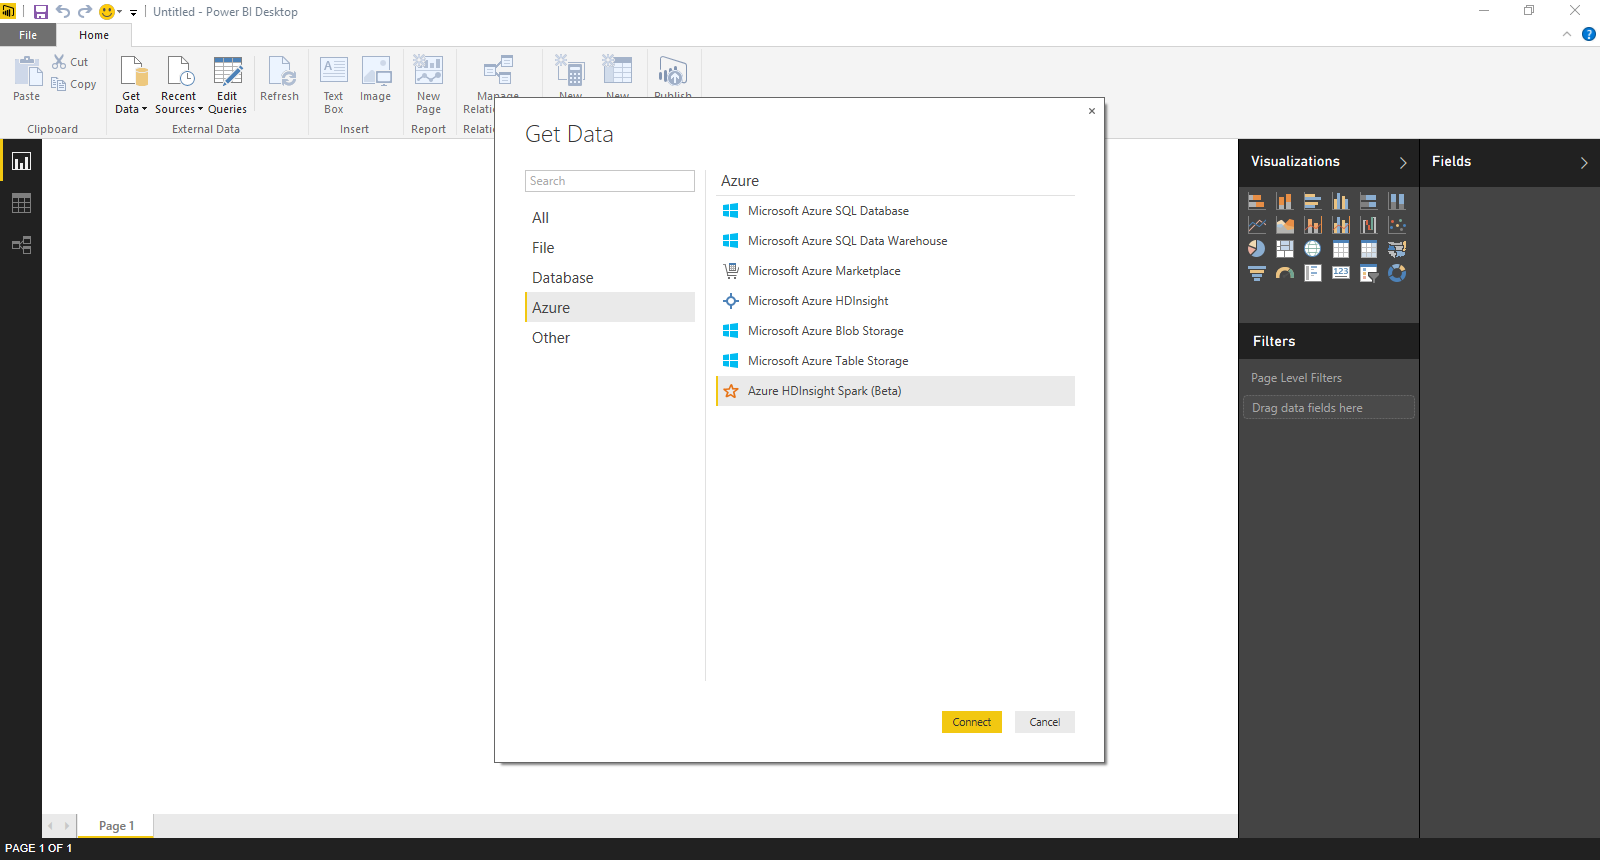
First go to Get Data and select Databases
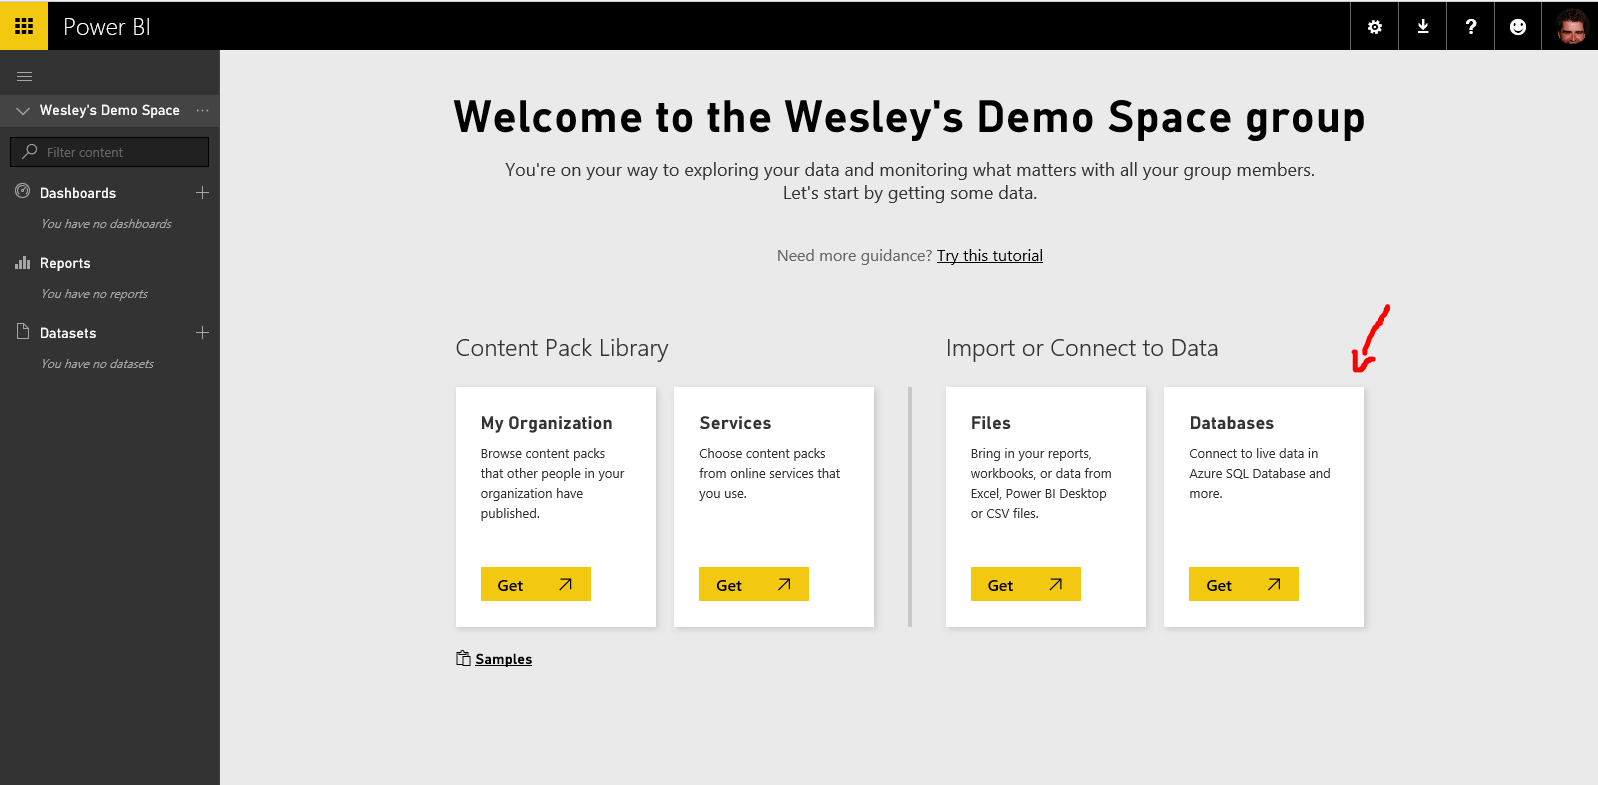
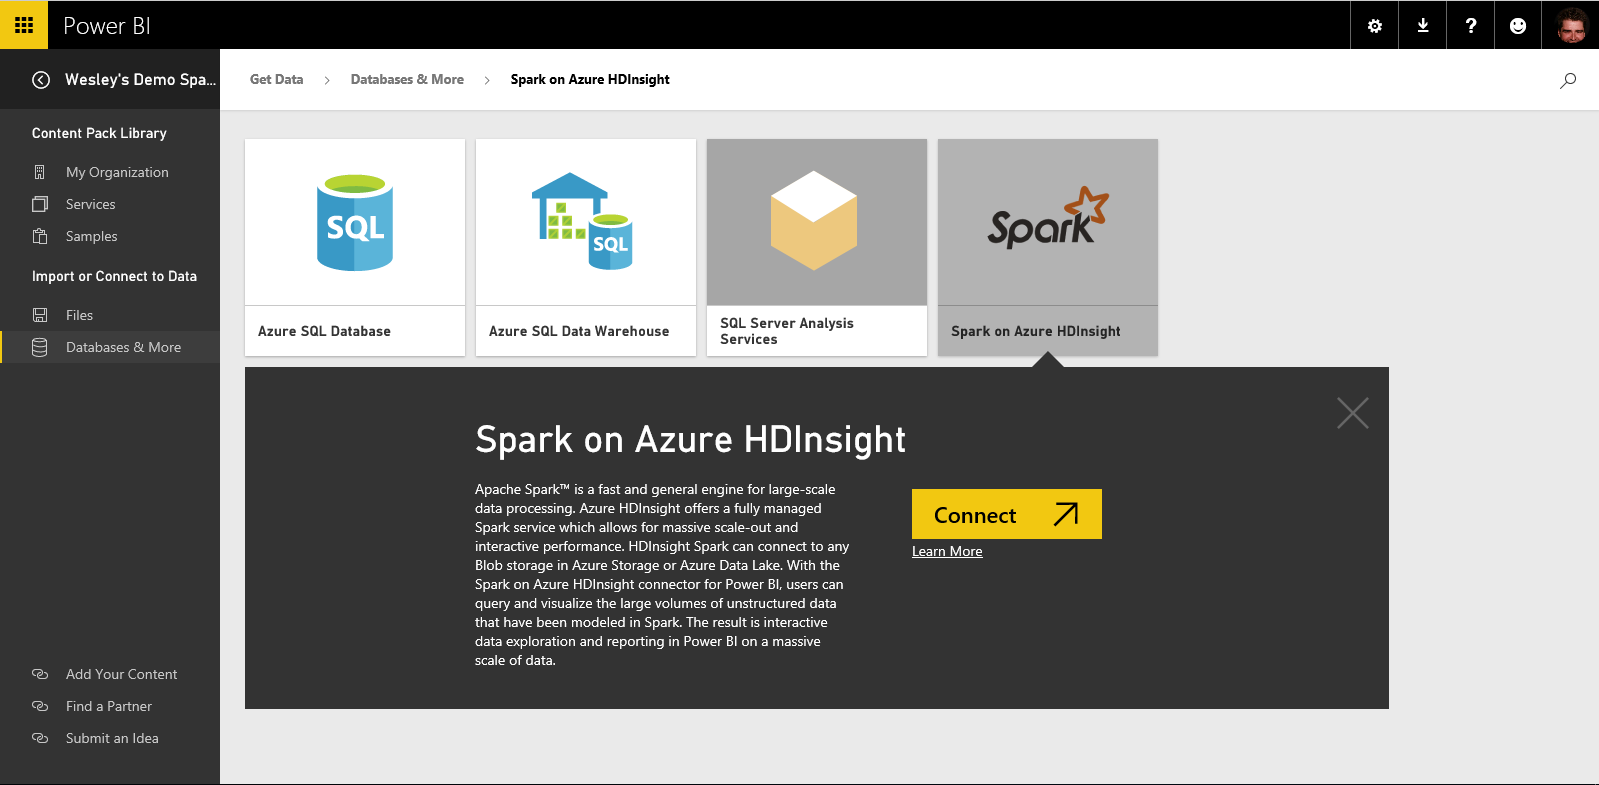
You will get the list of data sources where we currently support a live connection. Here you obviously have to select Spark and select click Connect.
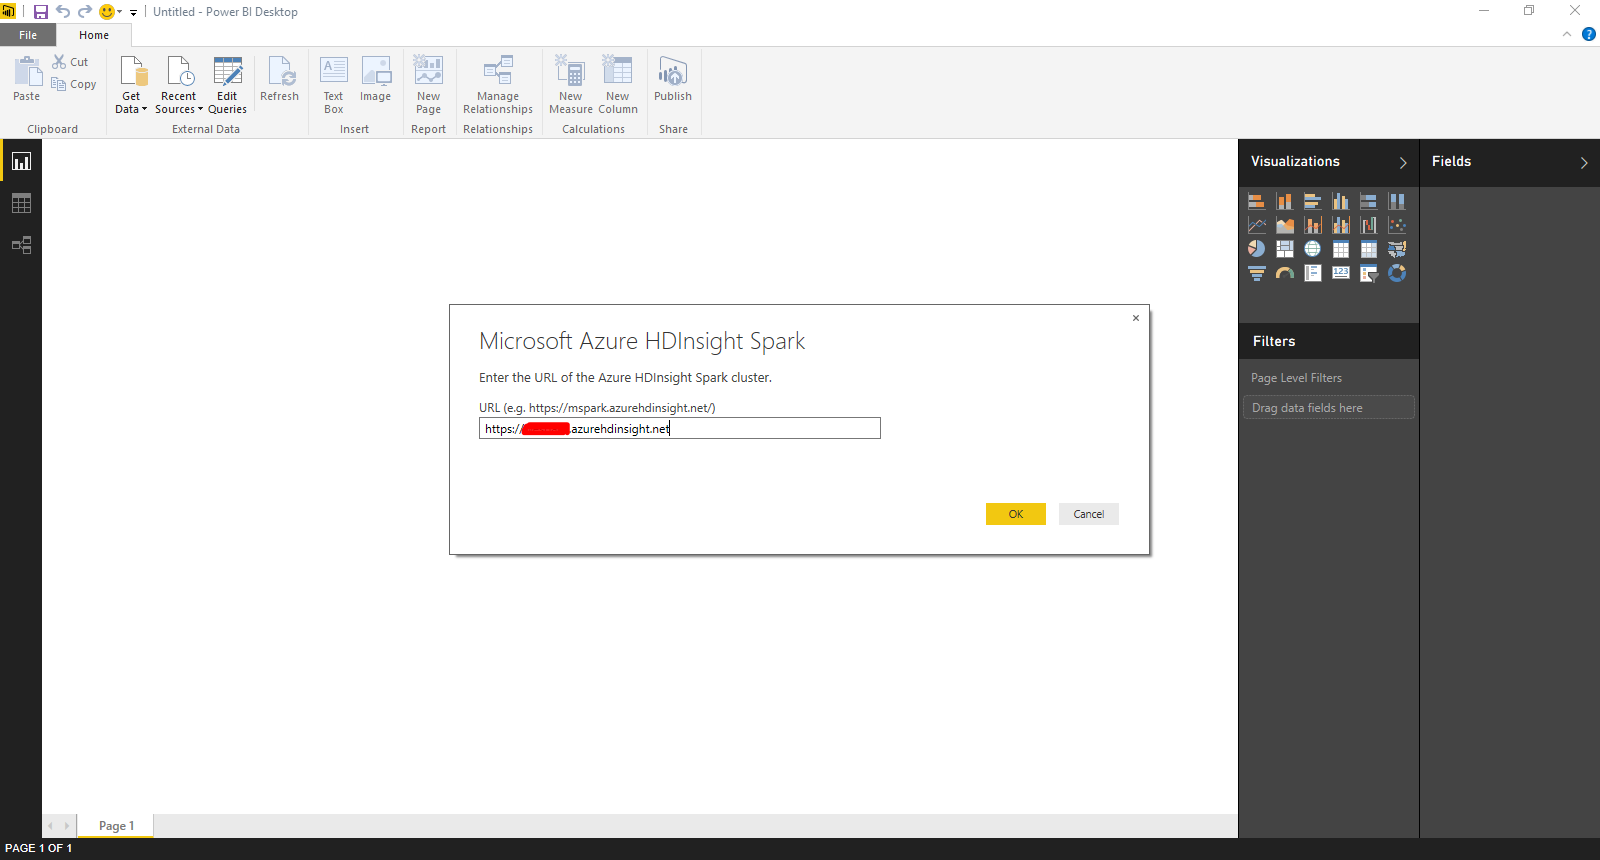
Enter the details of your cluster (clustername.azurehdinsight.net)
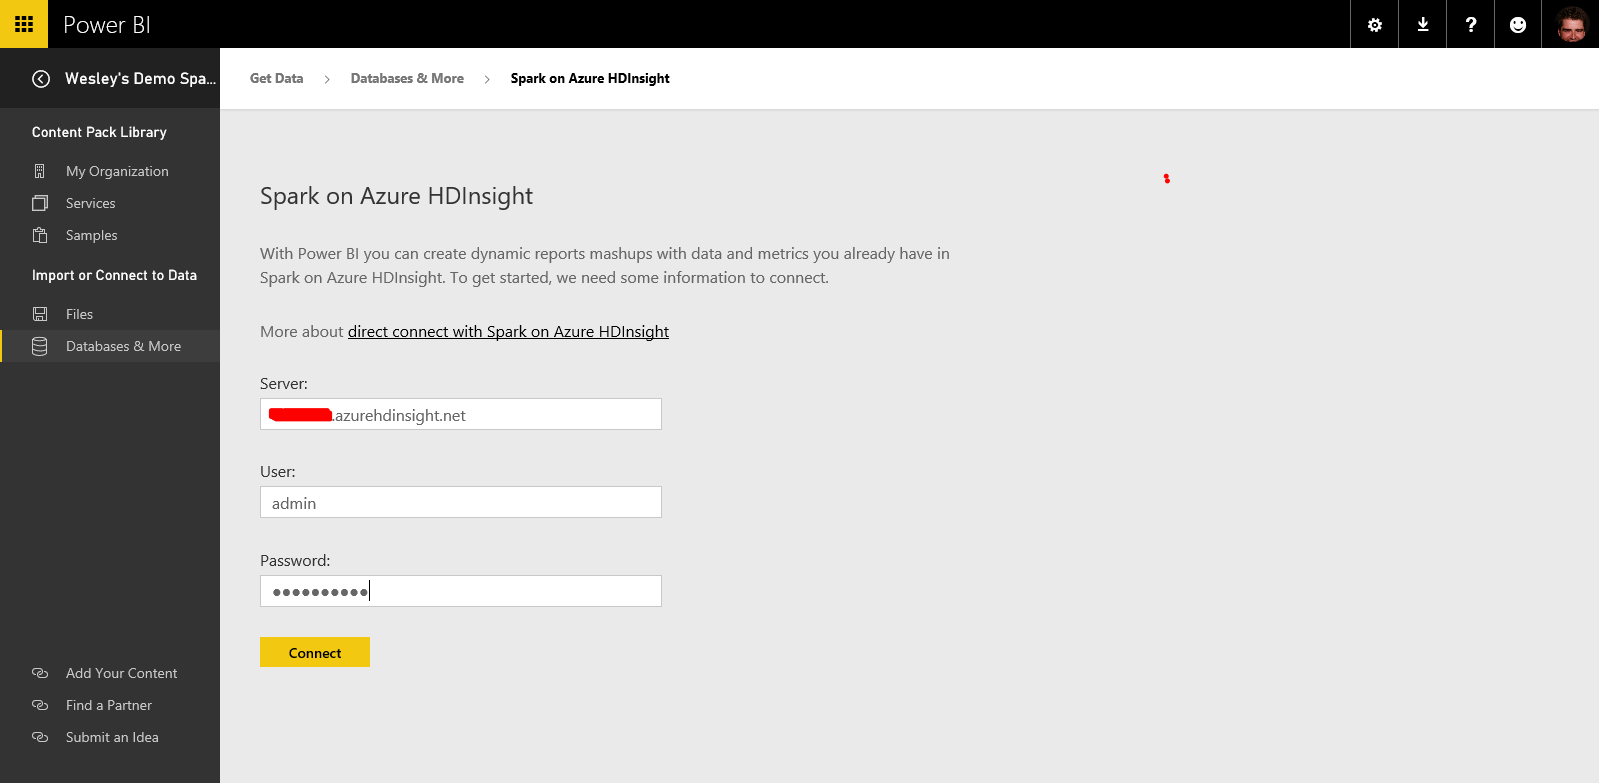
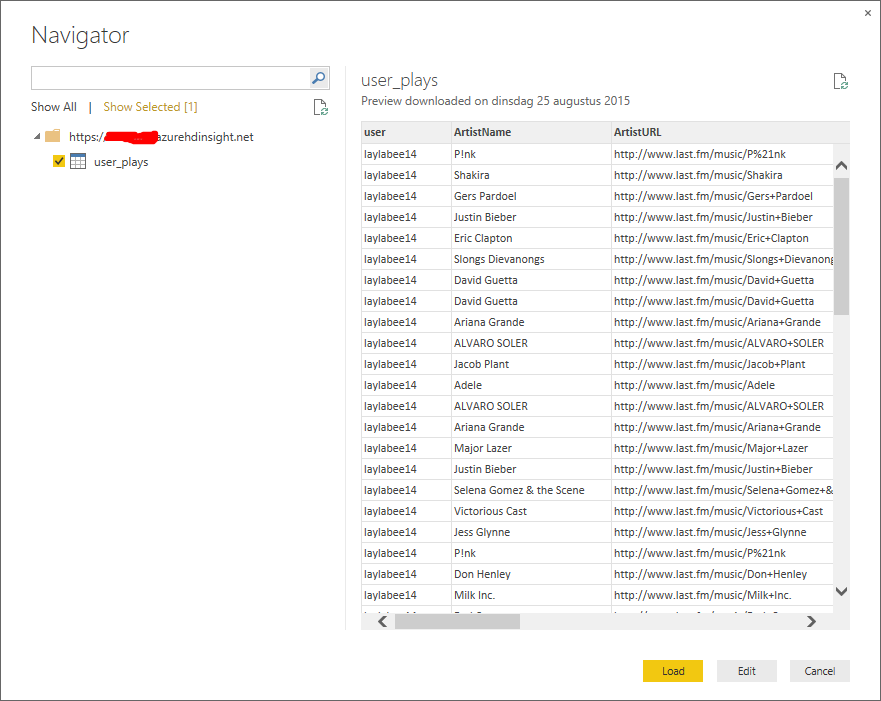
That's basically it, you are now connected to the Spark cluster and you can start digging into the data.
Another option is to use the Power BI Desktop if you want to enrich the data with additional calculations or transformations.
You will have to download the Spark ODBC driver if you want to use Power BI Desktop to connect to your Spark cluster, you can get that here.
Now let's try to see if I had some influence on my daughter (on her music choice at least :-)). Let's start by connecting to the Spark cluster from our Power BI Desktop.
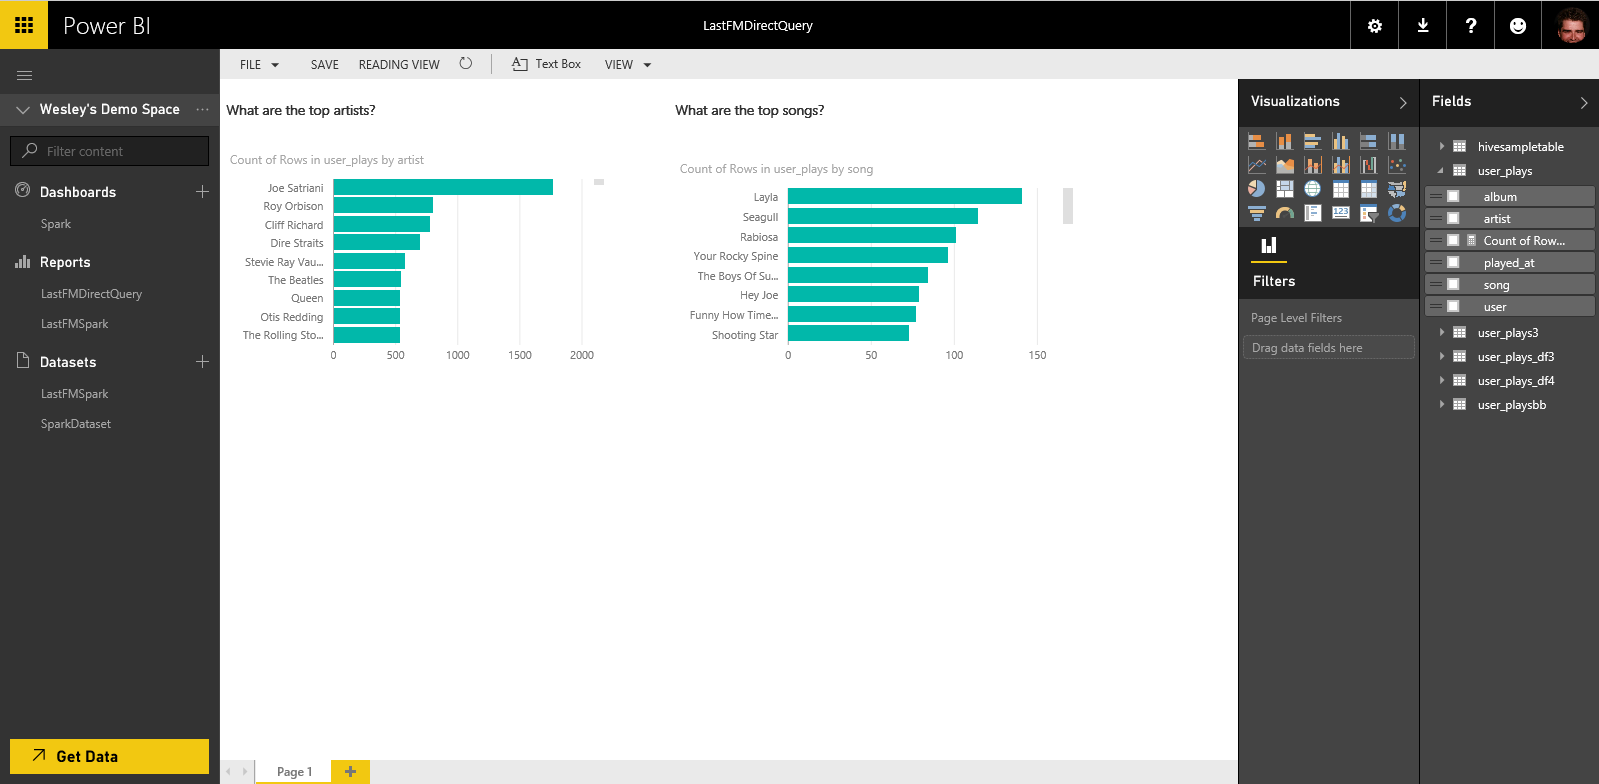
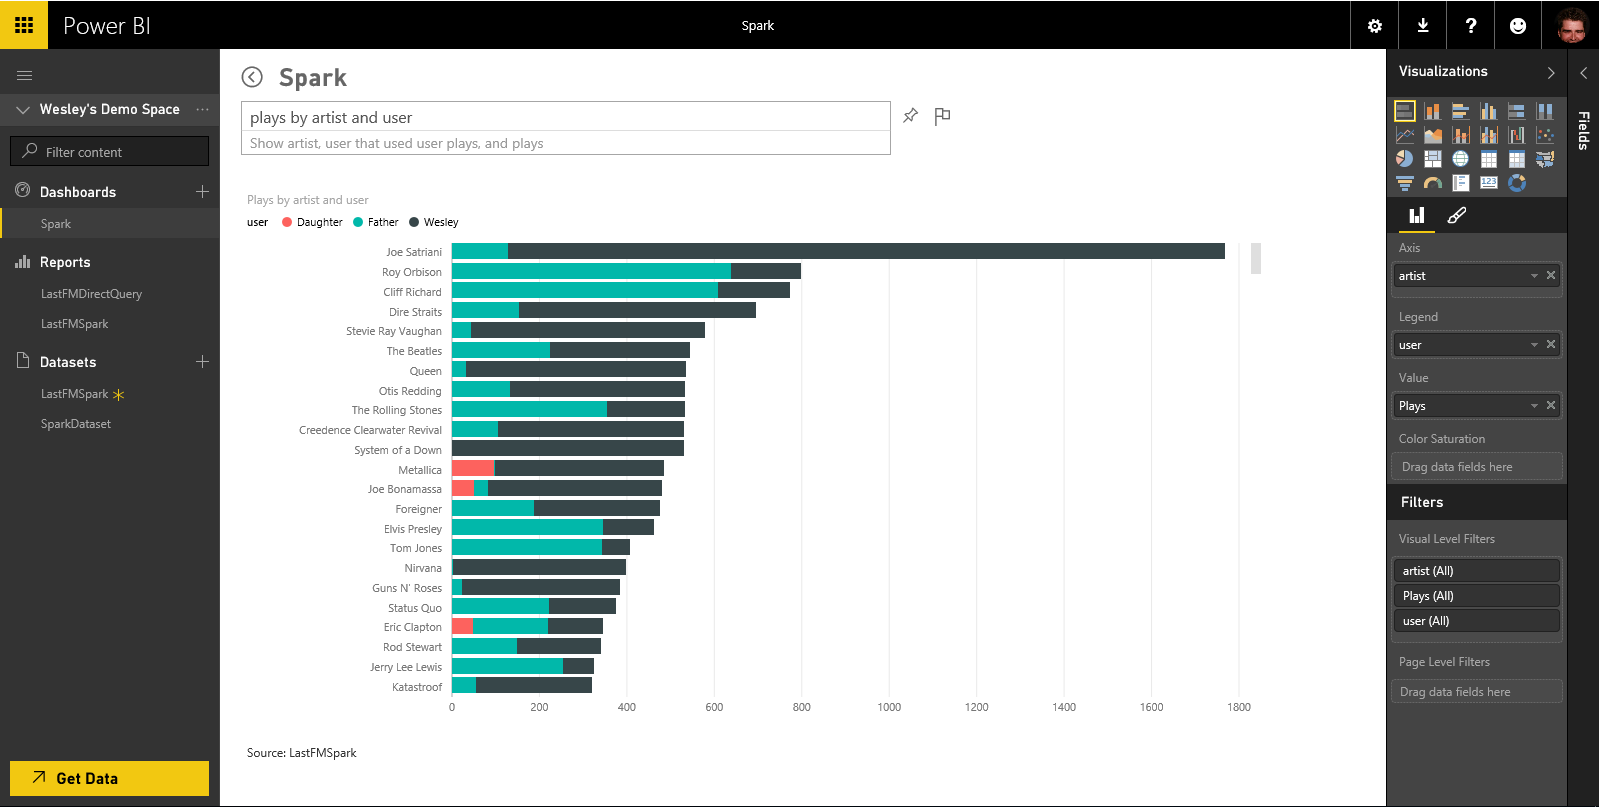
Let's look at the dashboard I have built to see the influence of my father on me and myself on my daughter. First thing I noticed is that my listening moments are completely different from my father's. You can see when my wife comes home by looking at the time I stop listening to music ;-) I was very happy to see the top songs for me and my daughter and I really hope she will keep on listening to this kind of music. Looking at the chart for me and my father I'm pretty sure he is thinking the same :-)
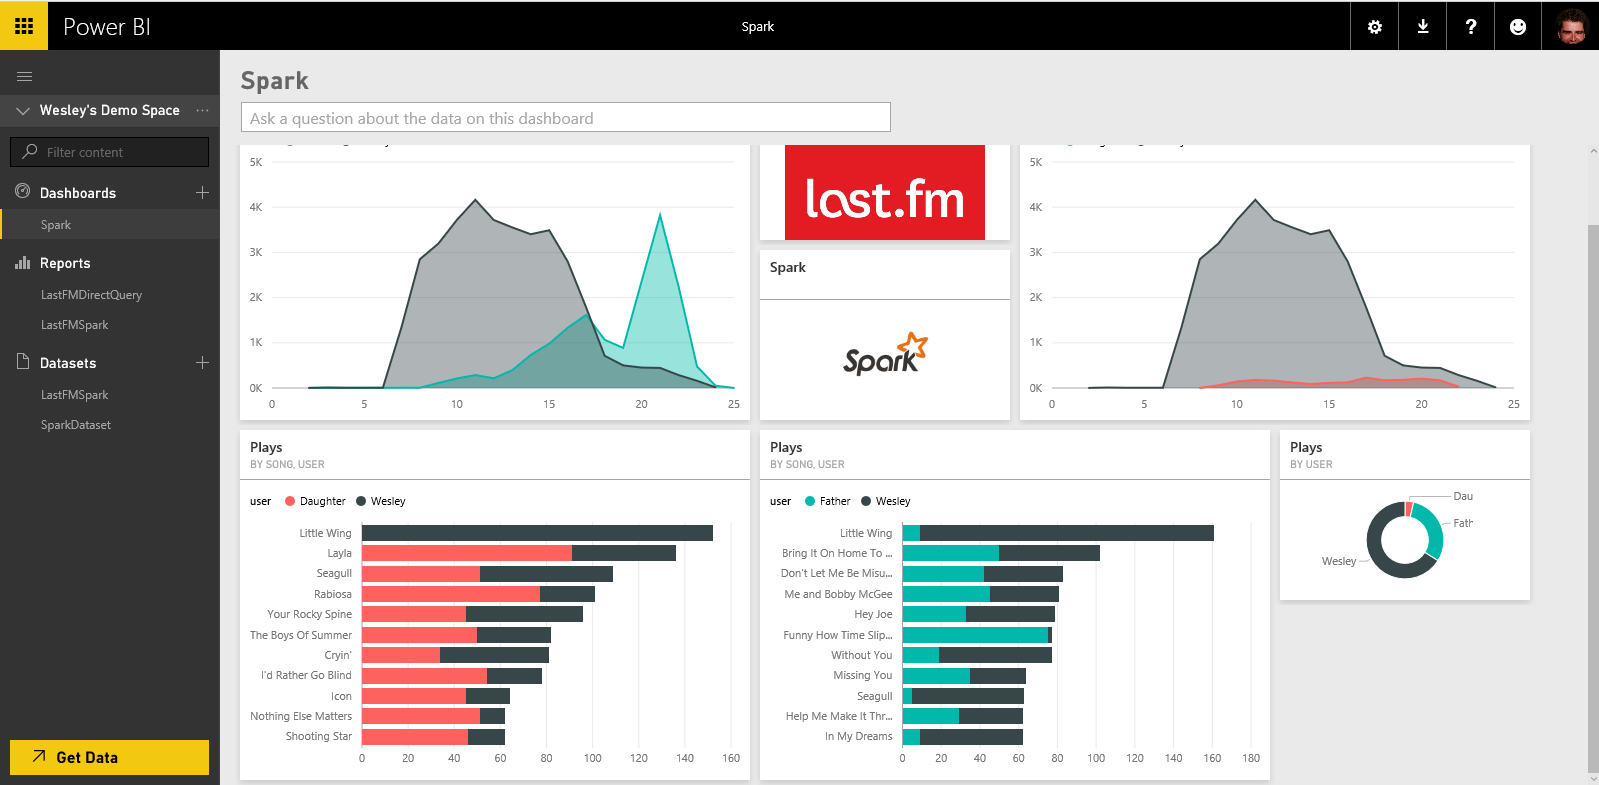
Since we are using the Power BI In-Memory model here I can also use Q&A to investigate trends.
I hope these posts make clear that you can get up and running incredibly quickly with Spark using Azure and go from raw data to beautiful visualizations.
Nathan and myself are already thinking about our next blog post about Spark... stay tuned!!!