Setting a Tracepoint in source code
Command: EditorContextMenus.CodeWindow.Breakpoint.BreakpointWhenHit
Versions: 2008,2010
Published: 2/7/2010
Code: vstipDebug0010
Most everyone knows what a Breakpoint is but, since Visual Studio 2005, we have had Tracepoints as well. Unlike Breakpoints, Tracepoints give you the opportunity to unobtrusively print out information during (or after) application execution. This tip will show you how to use the IDE to create Tracepoints but detailed instructions on how to do this in code can be found here:
https://msdn.microsoft.com/en-us/library/zs6s4h68(VS.100).aspx
Okay, so let's look at how to create a Tracepoint in your source code!
The best way to illustrate simple Tracepoints is with a basic loop. I would suggest creating a new project and cranking out a simple for loop to play with this stuff. Here is my sample code:
There are a couple of ways to set a Tracepoint on a line of code:
Right-click on the line and choose Breakpoint -> Insert Tracepoint
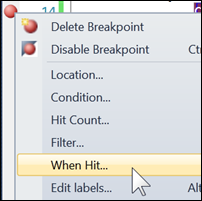
Set a Breakpoint (F9) and then Right-click on the Breakpoint in the Indicator Margin (aka the gutter) and choose "When Hit."
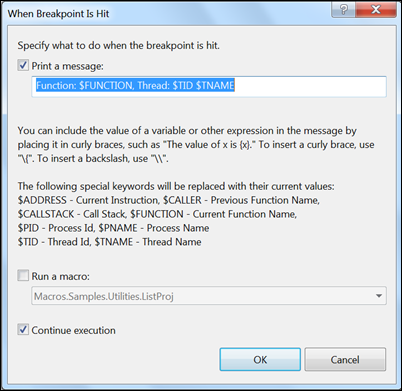
Regardless of which technique you use, you get the "When Breakpoint is Hit" dialog:
This essentially breaks down into three areas
- "Print a message" is used to print out any special variables (that begin with a $), evaluated expression (inside curly braces), and/or literal text.
- "Run a macro" is used to actually run a macro when this Tracepoint is hit and can do extended processing or kick off some other task.
- "Continue execution" does exactly what it sounds like it makes the Tracepoint unobtrusive and let's the application run. If you deselect this option the Tracepoint just acts like a Breakpoint.
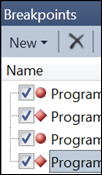
Click OK and notice something interesting. The normal round Breakpoint indicator is now a diamond:
This is how we distinguish Breakpoints (stop execution) from Tracepoints (don't stop execution). For example, if I were to turn off "Continue execution" on the Tracepoint its symbol would become a round Breakpoint symbol.
By the way, Tracepoints show up along with Breakpoints in the Breakpoints Window:
At this point you have enough to see Tracepoints in action, so run your application. It should execute and then end. Open up the Output Window (Debug -> Windows -> Ouput) and notice the entries from our Tracepoint:
There is a LOT more to learn here but you have a good start. One thing you might want to do is change the default output message (currently "Function: $FUNCTION, Thread: $TID $TNAME") that you get when you set a new Tracepoint. You can do that by going into the registry to this key:
WARNING: Editing the Registry can mess you up big time so make sure you know what you are doing before following these steps!
HKEY_CURRENT_USER\Software\Microsoft\VisualStudio\10.0\Debugger
Then modify the string value called DefaultTracepointMessage to the new default you would like to have.


