Data Points
Report Controls in SQL Server 2005 Reporting Services
John Papa
Code download available at:DataPoints2006_07.exe(391 KB)
Contents
Creating Charts
Embedding Expressions in Charts
Report Links
Creating the Link
Embedded Code
Accessing .NET Code
Security Policies
Accessing Code via a Report
Wrap Up
Reporting has always been one of the dark arts of development. The tools typically seem to do just enough to get you to a certain point, then leave you to find workarounds to solve more complex issues. Fortunately, reporting has evolved quite a bit over the past few years.
SQL Server™ 2005 Reporting Services lets you embed code in a report that can be accessed by various properties of that report, and it takes this concept a step further by allowing you to access external .NET libraries. It also offers a few techniques to integrate expressions and .NET code within a report, providing access to business logic and XML files.
Creating Charts
SQL Server 2005 Reporting Services includes a basic chart control that handles most situations quite nicely, and third-party chart controls are available as well. The chart controls let you set categories for the x axis and data points for the y axis, and you can add one or more series to the chart.
To create a chart, you can drag a chart control onto the report designer in the Layout tab. The chart control automatically goes into "set me up" mode, letting you drag the DataSet’s fields into the category, data, and series areas. The fields you drag into the category area are used for the x axis while those dragged to the data area are used as the data points that define the bars, pie chart, or lines (see Figure 1). You need at least one field in each of these areas to create a useful chart, though you can add more if you want.
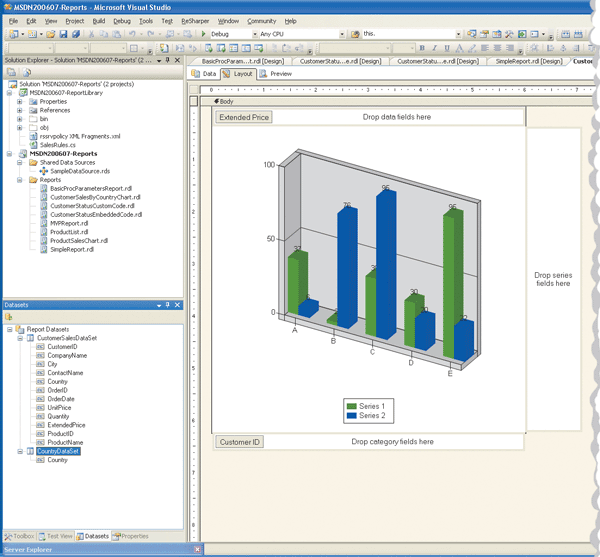
Figure 1** Creating a Chart with Drag and Drop Chart Controls **
You can also drag fields to the series area to show more than one set of data points on the chart. For example, if you want to show the sales for a particular customer by month, you could start by setting a filter to show only that customer. You’d then drag the sales field to the data area and the sale date field to the category area and change its value property to something like the following expression, which effectively groups the orders by month:
= Year(Fields!OrderDate.Value) & "-" & Month(Fields!OrderDate.Value)
If you wanted to build on this chart by comparing customer A to customer B, you could drag the customer field to the series area. Assuming you’re using a bar or column chart (which lend themselves nicely to this type of comparison), you’ll see both customers’ sales by month, with each customer identified by a different color bar or column. Series should be used only when necessary as they do dramatically increase the number of data points shown on the chart. You’ll have to weigh the value of showing more data against being able to quickly read and understand the graph.
Figure 2 shows the total sales for each customer in a given country. Each slice of the pie chart represents a customer’s sales in the selected country. The country is chosen by the user via a report parameter which gets a list of countries from a query separate from that which fills the pie chart. (For more details on how to create and establish report parameters, see my June 2006 Data Points column.
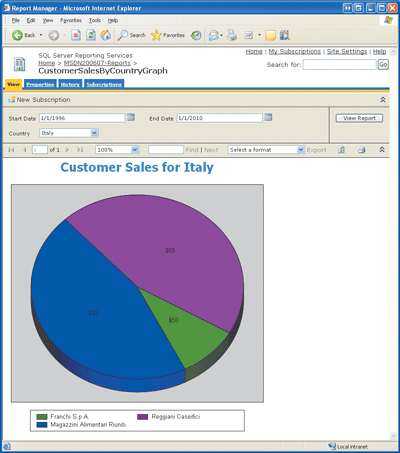
Figure 2** Parameter-Driven Pie Chart **
Switching the type of chart is as easy as going to the Layout tab of the report designer, right-clicking the chart control, and selecting the chart type from the popup menu where you’ll find a variety of charts. Figure 2 represents the data as a pie chart, but you could easily change this to a column, line, or bar chart by selecting the chart type and redeploying the report.
Embedding Expressions in Charts
One of the coolest features of SQL Server 2005 Reporting Services is how you can embed expressions in just about every property in a report. For example, you can set a chart’s title using a simple concatenation expression, as I did for the chart in Figure 2:
= "Customer Sales for " & Parameters!country.Value
Notice that the title in Figure 2 says "Customer Sales for Italy." That’s because the user selected Italy as the country from the report parameter. You can use expressions to set just about any property of the chart, including the color of the bars, the data point labels, or the axis labels. Expressions are critical to reports since they are used throughout to configure so many aspects, including the properties of chart controls, filters, SQL parameters, and to create report links. (The report in Figure 2, CustomerSalesByCountryChart.rdl, is included in this month’s code download.)
Report Links
The ability to embed report links lets you enable users to drill into information on the fly without having to show everything on a single report. For example, suppose a manager is looking at a list of products and their inventories. While examining a product with a low inventory, the manager becomes curious as to how the inventory got so low and wants to be able to quickly see the sales totals for that product. By creating an embedded link within the product list report to another report that shows a chart of the product’s sales, the manager can quickly and easily get her answer.
Report links can be embedded within many elements of a report including header, details, and footer controls as well as in data points in a chart. Report links can navigate to a bookmark in the current report, a sub-report, an entirely different report, or a separate URL. The report links can also pass parameters to the destination, which is how in the previous example the manager clicking on a product in a product list report links to a chart showing that product’s sales.
To demonstrate report links, I created two reports: a product list report (ProductList.rdl) and a product sales chart report (ProductSalesChart.rdl). The product list report simply fills a DataSet with the ProductID and the ProductName fields form the Northwind Database’s Products table. The products are then displayed on the report using a table control containing textbox controls for the fields.
For the product sales chart report, I created a DataSet inside the report that gets the orders for all of the customers for a specific product and date range. Then I put a chart control on the report in the layout tab. I made the chart type "Simple Column" and set it to be 3D with the columns set to be Cylinders. (The latter two settings are on the 3D Effect tab on the chart control’s properties page.) I then dragged the Order Date field onto the category area and dropped the Extended Price field onto the data area. Since I wanted to show the total sales amount (sum of Extended Price) for each month, I set the value expression for the Order Date field to use the year and month of the order date.
When I created the DataSet that grabs the total sales from a stored procedure, the report created report parameters that match the parameters required by the stored procedure. Thus, the Report Parameters dialog already contains three parameters: startDate, endDate, and productID. For simplicity, to grab all of the data in Northwind, I set the start and end dates to 1/1/1996 and 1/1/2010. In a real-world situation I’d probably set the start date to one year ago today and the end date to today, so the report would show a year’s time by default.
The user should be able to choose the product that drives the chart, so I modified the productID report parameter to let the user select the ProductName from a dropdown list (for more information on report parameters, see the June Data Points column). Now the chart can run on its own and once the user selects a product, the chart will show the sales for the product by month.
Creating the Link
Once I had the two reports, I created a link in the product list report’s ProductName to connect to the product sales chart report and pass it the ProductID that was clicked. I went back to the product list report and selected the textbox control that displays the product’s name and went to its properties. Next I went to the Navigation tab, set the Hyperlink action to "Jump to a report," and selected the ProductSalesChart report from the dropdown list. Then I clicked on the Parameters button and passed the parameters, as shown in Figure 3. Notice that I’m sending the ProductID from the selected row (Fields!ProductID.Value) to the product sales chart report. At this point I can preview the product list report (see Figure 4), click on a product and the second report’s chart will appear (see Figure 5) showing that product’s sales by month.
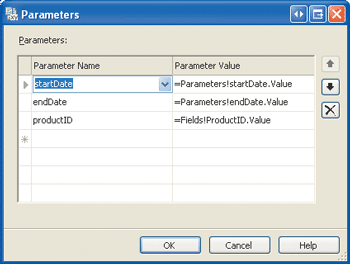
Figure 3** Linking Report Parameters **
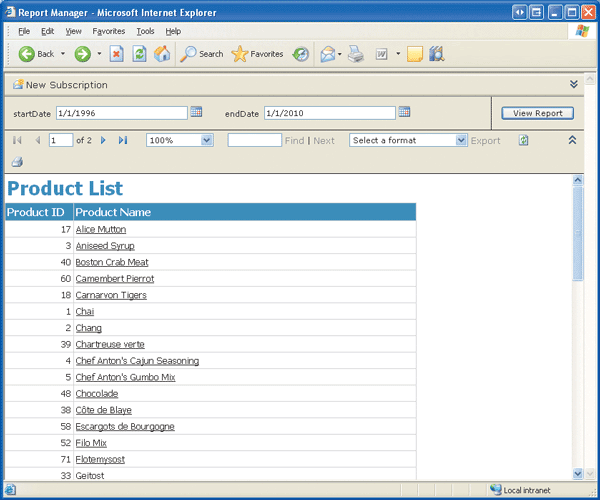
Figure 4** Viewing a Report with Links **
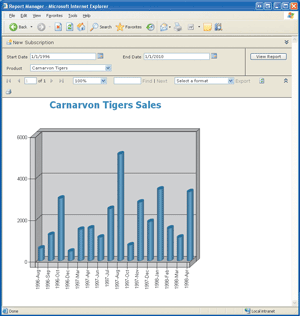
Figure 5** Linked Product Sales Chart **
Report links are very handy for creating drilldown charts that let users click on a bar or a pie slice and link to another report to show more detailed information. They’re also useful for scenarios in which you want to link to an external application. For example, you could set the link to point to a URL (instead of another report) where the URL links directly to a Web application and passes its parameters via a querystring. This is a nice feature to use on reports that show detailed data (such as individual sales reports) and that allow the user to click on the report to go directly to the sale in the Web application.
One caveat about report links is that finding where to set them can involve clicking into several sub-menus. Setting report links for a textbox is as simple as going to the Navigation tab in the property dialog. But setting them for a bar in a chart means going to the chart’s property dialog, clicking on the Data tab, selecting the Data Value from the list and clicking its Edit button, then going to the Action tab of the Edit Chart Value dialog that appears and, finally, setting the link.
Embedded Code
Often when I design reports I find I’m repeating certain expressions throughout different properties. For example, when I want to group a report based on the YYYY-MM format, I create the expression within the category’s "Group On" property. Then I might decide to use the same expression for the label of the tick marks of the category in the x axis, so I repeat the expression in the category’s Label property. Sometimes I use the same expression over and over throughout a report, and copy and paste just gets ugly.
Luckily, reports support embedded code that can be entered through the report’s property dialog on the Code tab. For example, formatting the date interval as YYYY-MM can be moved to a method in the Code window, which makes that method available everywhere within the report. To format the date interval, I could create the following function and put it in the Code window:
Function FormatDateInterval(ByVal value As DateTime) As String Return Year(value) & "-" & Month(value) End Function
You might notice this code is written in Visual Basic®. That’s because at this time embedded code only supports Visual Basic.
The function can be accessed throughout the report as a member of the class called Code. The Code class is instantiated by the report once and its methods can be accessed throughout the report. In place of the expression I could use the following line of code to reference the FormatDateInterval method:
=Code.FormatDateInterval(Fields!OrderDate.Value)
One of the biggest advantages to using embedded code is that you can encapsulate methods required by a report in a single place within the report. The embedded code in the Code window is put inside a special XML element in the report’s RDL file. This means that the code is deployed automatically with the report wherever it goes.
If you prefer C# or another .NET language, you’ll have to access a separate .NET assembly. And keep in mind when using embedded code that the methods can be accessed only by the report that contains them. The embedded code window is merely a large textbox and offers no IntelliSense® or built-in debugging features. But for creating quick methods that are intended to be accessed by a single report, the code window is a very simple and effective tool.
If you want multiple reports to use the same code, you should consider accessing a .NET assembly from the embedded code, as I’ll demonstrate in the next section. Security policies prevent the report from performing anything beyond basic operations in embedded code, such as accessing external files, databases, or other resources. Your report can reference .NET assemblies from the References tab in the report properties dialog, but any referenced assembly will, by default, have only Execution permission.
Accessing .NET Code
It makes sense to access .NET code from a report when you have common logic you want multiple reports to share, when your existing .NET code contains business logic your reports can use, and when you want to access a file or another resource from your report.
Writing a custom .NET assembly is more involved than using the embedded code window, but it has some great advantages. You can use any .NET language to develop the custom code and you get all of the features built into Visual Studio®, such as a sophisticated debugger and IntelliSense. It’s also good practice to design your code to be reusable, and by encapsulating methods that will be accessed by your reports you are adhering to that principle. Plus, you can access files or other resources from the custom code and place appropriate security on the assembly under SQL Server 2005 Reporting Services.
My example assumes a business rule that specifies a customer’s level as gold, silver, or bronze based on their total sales over a year. I’ll define this business logic in a custom .NET assembly that will contain the rules that dictate a customer’s status. (All code in this example is also available in the download on the MSDN® Magazine Web site.)
Accessing code in a custom .NET assembly requires several steps. First, I’ll create the .NET class library that contains the business logic. I’ll add post-build events to the .NET project that will copy its assembly to the appropriate folders so the report can access the assembly when it’s executed either in the Report Manager Web interface or in the Visual Studio IDE. Then I’ll reference the custom .NET assembly in a report and create a Visual Basic method in the report’s Code window to invoke the custom assembly’s business logic. Finally, I’ll create an expression in the report’s detail rows that uses the method I created in the Code window (that calls the custom code).
The code in Figure 6 shows the custom .NET class in my MSDN200607 ReportLibrary project. The GetStatusLevel method accepts the total sales for a customer and returns a string value representing the status. I created a post-build event that copies the assembly to the folders that the reports have access to. (Of course the post build event is not necessary if you want to manually copy the files to the locations.)
Figure 6 Custom .NET Class
using System; using System.Security.Permissions; namespace MSDN200607_ReportLibrary { public class SalesRules { private enum _SalesLevel: int { Gold = 1, Silver = 2, Bronze = 3 } public SalesRules(){} [PermissionSet(SecurityAction.Assert, Unrestricted = true)] public static string GetStatusLevel(decimal totalSales) { if (totalSales >= GetSalesLevelAmount(_SalesLevel.Gold)) { return _SalesLevel.Gold.ToString(); } else if (totalSales >= GetSalesLevelAmount(_SalesLevel.Silver)) { return _SalesLevel.Silver.ToString(); } else return _SalesLevel.Bronze.ToString(); } private static decimal GetSalesLevelAmount(_SalesLevel salesLevel) { switch (salesLevel) { case _SalesLevel.Gold: return 1000; case _SalesLevel.Silver: return 500; case _SalesLevel.Bronze: default: return 0; } } } }
The custom .NET assembly must be copied to the C:\Program Files\Microsoft Visual Studio 8\Common7\IDE\PrivateAssemblies folder for the report to be able to access it when previewed in the report designer. (If your installation location of Visual Studio differs, adjust the location appropriately.) Reports running under SQL Server 2005 Reporting Services directly can access assemblies located in the C:\Program Files\Microsoft SQL Server\MSSQL.x\Reporting Services\ReportServer\bin. (Replace MSSQL.x with the appropriate folder where your installation of SQL Server 2005 Reporting Services is located.)
Security Policies
You may also need to modify the security policy to allow the report to access the custom .NET assembly. When reports run in the report designer’s preview tab, the security policy is set to FullTrust by default, so you may not need to modify the policy to allow additional permissions. In case you do, though, the policy configuration file for the report designer is located at C:\Program Files\Microsoft Visual Studio 8\Common7\IDE\PrivateAssemblies\RSPreviewPolicy.config. It’s a very good idea to back up the policy file before making any modifications.
The security policy file for SQL Server 2005 Reporting Services is located at C:\Program Files\Microsoft SQL Server\MSSQL.x\Reporting Services\ReportServer\rssrvpolicy.config. You’ll need to modify it if your custom .NET assembly requires more than Execution permissions. The easiest way is to create a named permission set that has the specific permissions my custom .NET assembly requires. For example, I created the following permission set and put it inside the rssrvpolicy.config file at the end of the other PermissionSet nodes:
<PermissionSet class="NamedPermissionSet" version="1" Unrestricted="true" Name="MSDN200607ReportLibraryPermissionSet" Description="Allows access to Sample Reporting resources"> <IPermission class="SecurityPermission" version="1" Flags="Execution, Assertion" /> </PermissionSet>
Then I added the MSDN200607ReportLibraryCodeGroup shown in Figure 7 to the same file at the end of the nested code groups. It uses the permission set I just created. This way my relaxed permissions as specified in the new permission set are limited to the new assembly.
Figure 7 Custom Code Group
<CodeGroup class="UnionCodeGroup" version="1" PermissionSetName="MSDN200607ReportLibraryPermissionSet" Name="MSDN200607ReportLibaryCodeGroup" Description="This code group grants permissions to the Sample Reports Library code full trust. "> <IMembershipCondition class="UrlMembershipCondition" version="1" Url="C:\Program Files\Microsoft SQL Server\MSSQL.3\ Reporting Services\ReportServer\bin\ MSDN200607-ReportLibrary.dll" /> </CodeGroup>
Accessing Code via a Report
Once I’ve created the assembly, copied it to the appropriate folders, and modified the security policy, the next step is to reference the assembly in a report. I referenced my assembly by opening the report (CustomerStatusCustomCode.rdl) in the report designer and going to the Layout tab. Then I opened the report properties, clicked the References tab, and browsed to find the assembly that my post-build event copied to the Reporting Services folder (see Figure 8).
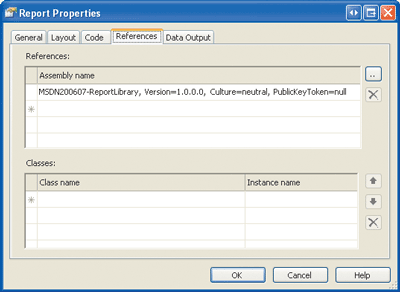
Figure 8** Referencing an Assembly in a Report **
At this point I could reference the custom code via an expression directly from the textbox in the details row. However, I prefer to consolidate all of the calls to custom code in the Code window. This way if the method’s signature (in the custom assembly) changes at some point in the future, I don’t have to search the report to find where I referenced the custom code. To do this I place the following code in the report’s Code window:
Function GetCustomerStatus(ByVal totalSales As Decimal) As String Return MSDN200607_ReportLibrary.SalesRules. GetStatusLevel(totalSales) End Function
This code simply acts as a relay between the report and the custom code. It may not be so apparent how useful this is, because my example is so simple. However, when I’ve had several custom methods nested throughout a report it’s been very helpful to be able to look in one place to see what methods the report uses from a custom assembly.
Finally, I added a textbox to the details row of my customer status report and set its Value property to the following expression:
=Code.GetCustomerStatus(Fields!ExtendedPrice.Value)
Here I reference the Code instance, which represents an instance of the class that’s created from the report’s code window. The expression passes the sales total for each customer to my custom method and returns the gold, silver, or bronze status. I also added an interactive sort to the Sales Total header column so I could easily see if the customers were assigned the appropriate sales status.
Wrap Up
Creating charts and report links and embedding code are all simple, yet effective ways to enhance SQL Server 2005 Reporting Services reports. Adding report links to your reports that link to other reports or even to other applications via a URL are great ways to enhance the user experience. Whether your business rules are written in .NET libraries already or you create custom assemblies to contain business logic just for the reports, you are only a few steps from taking advantage of that .NET code.
Send your questions and comments for John to mmdata@microsoft.com.
John Papa is a Senior .NET Consultant with ASPSOFT (aspsoft.com) and a baseball fanatic who spends most of his summer nights rooting for the Yankees with his family and his faithful dog, Kadi. John, a C# MVP, has authored several books on ADO, XML, and SQL Server, and can often be found speaking at industry conferences such as VSLive.