Check fleet metrics of Microsoft Entra Domain Services
Administrators can use Azure Monitor Metrics to configure a scope for Microsoft Entra Domain Services and gain insights into how the service is performing. You can access Domain Services metrics from two places:
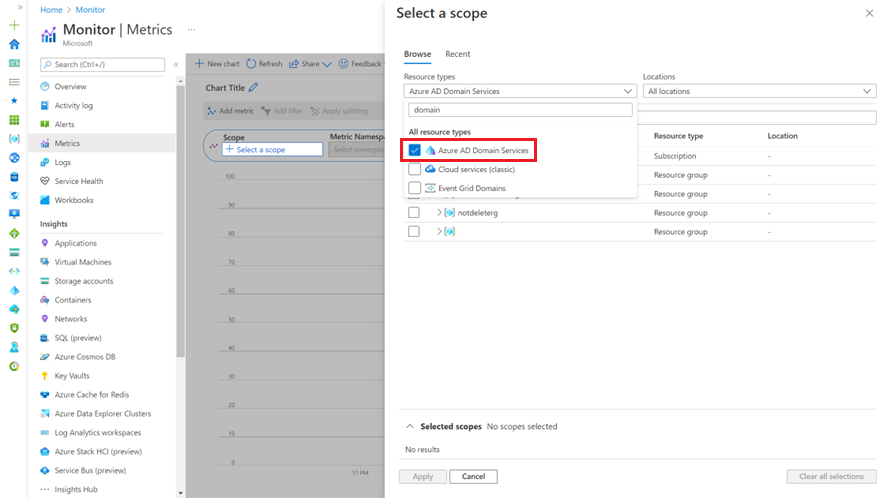
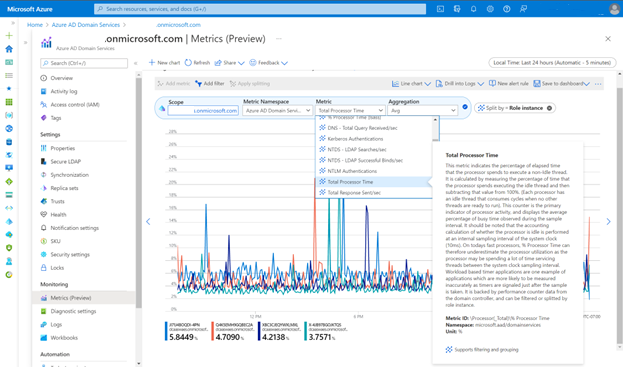
In Azure Monitor Metrics, click New chart > Select a scope and select the Domain Services instance:
In Domain Services, under Monitoring, click Metrics:
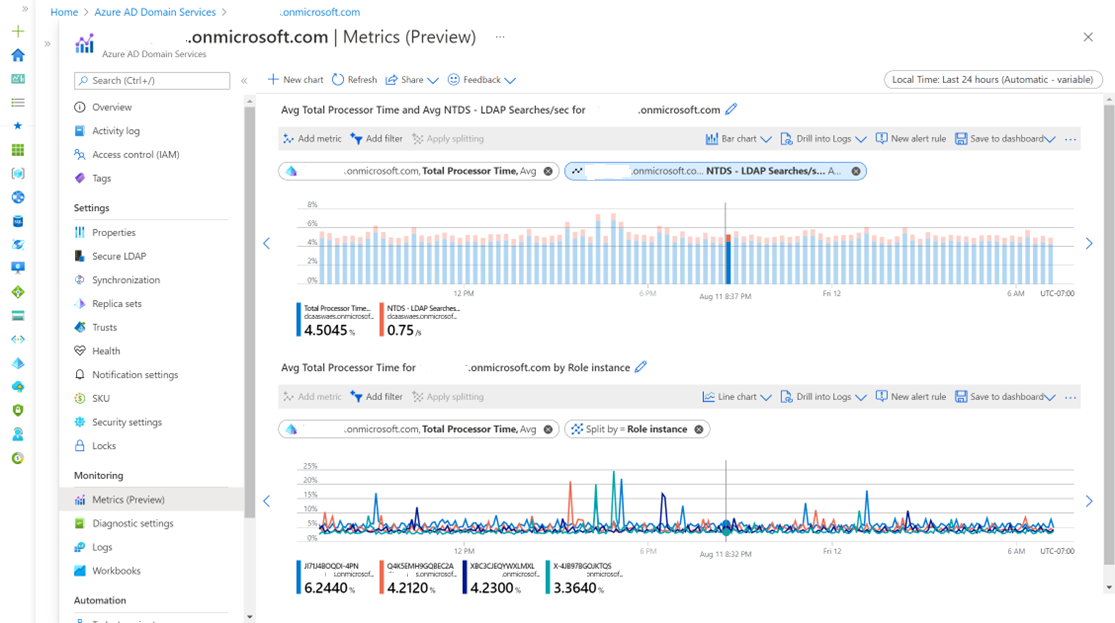
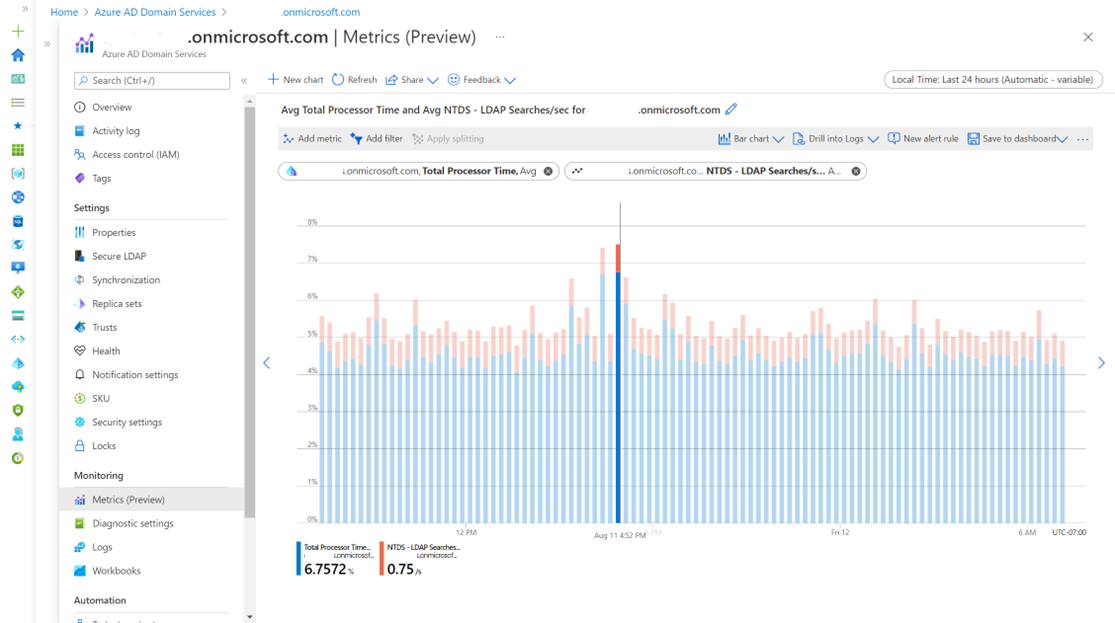
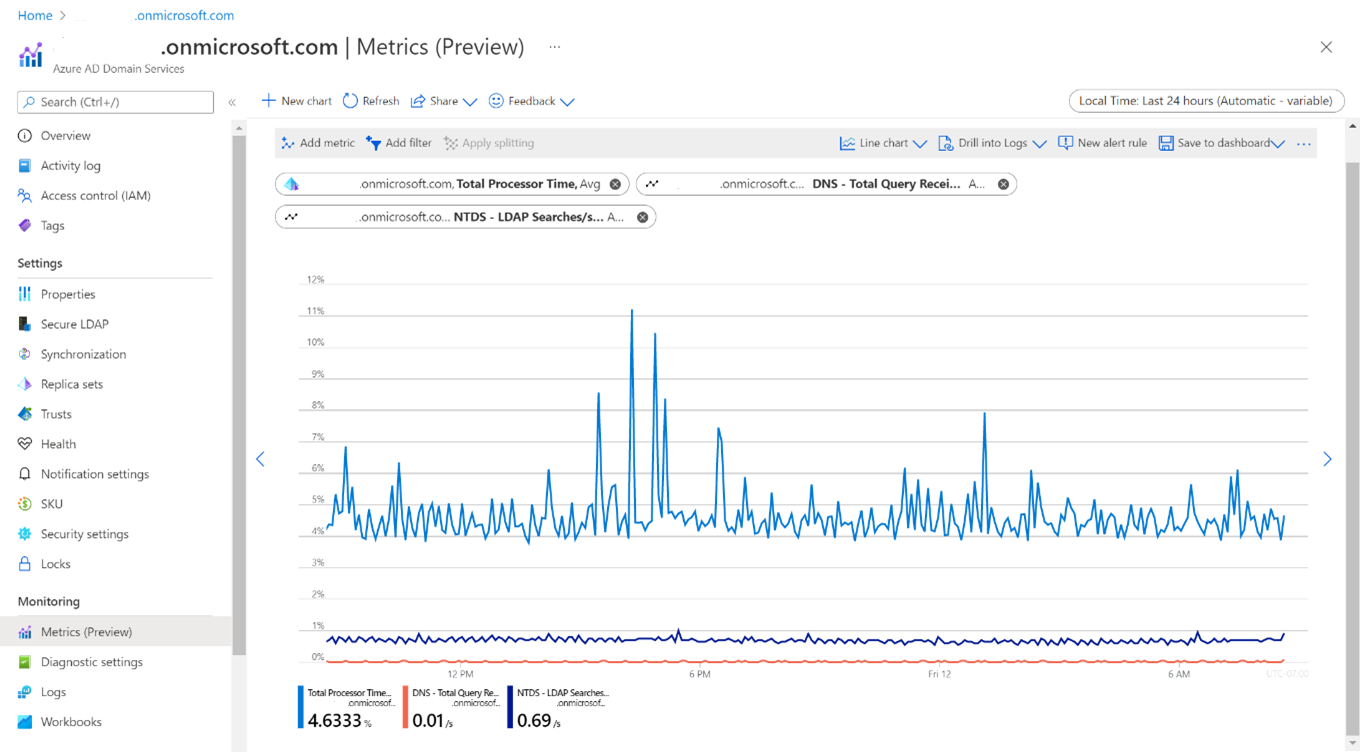
The following screenshot shows how to select combined metrics for Total Processor Time and LDAP searches:
You can also view metrics for a fleet of Domain Services instances:
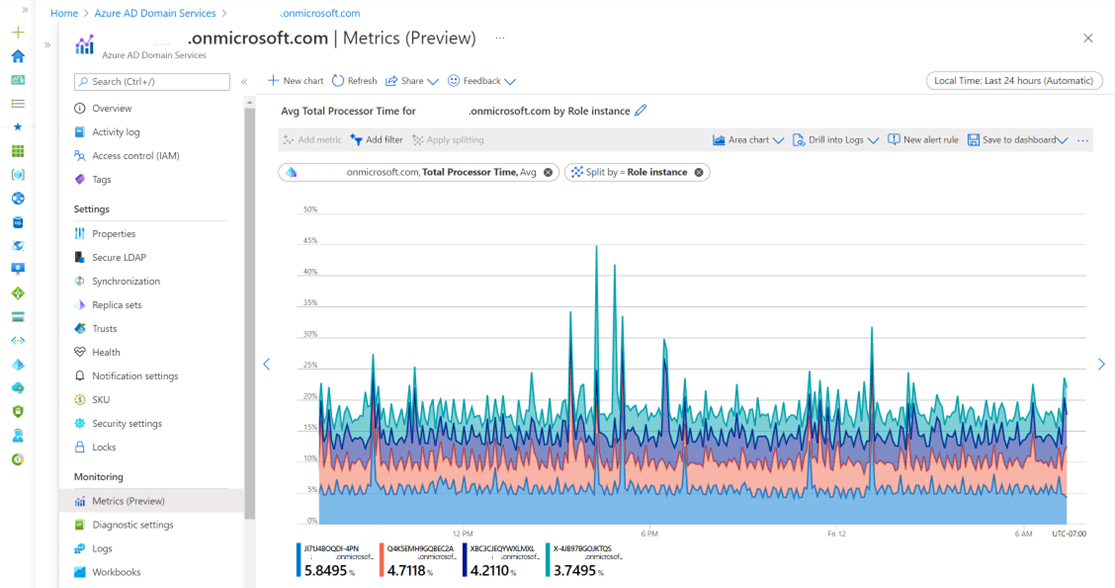
The following screenshot shows combined metrics for Total Processor Time, DNS Queries, and LDAP searches by role instance:
Metrics definitions and descriptions
You can select a metric for more details about the data collection.
The following table describes the metrics that are available for Domain Services.
| Metric | Description |
|---|---|
| DNS - Total Query Received/sec | The average number of queries received by DNS server in each second. It's backed by performance counter data from the domain controller, and can be filtered or split by role instance. |
| Total Response Sent/sec | The average number of responses sent by DNS server in each second. It's backed by performance counter data from the domain controller, and can be filtered or split by role instance. |
| NTDS - LDAP Successful Binds/sec | The number of LDAP successful binds per second for the NTDS object. It's backed by performance counter data from the domain controller, and can be filtered or split by role instance. |
| % Committed Bytes In Use | The ratio of Memory\\Committed Bytes to the Memory\\Commit Limit. Committed memory is the physical memory in use for which space has been reserved in the paging file should it need to be written to disk. The commit limit is determined by the size of the paging file. If the paging file is enlarged, the commit limit increases, and the ratio is reduced. This counter displays the current percentage value only; it isn't an average. It's backed by performance counter data from the domain controller, and can be filtered or split by role instance. |
| Total Processor Time | The percentage of elapsed time that the processor spends to execute a non-Idle thread. It's calculated by measuring the percentage of time that the processor spends executing the idle thread and then subtracting that value from 100%. (Each processor has an idle thread that consumes cycles when no other threads are ready to run). This counter is the primary indicator of processor activity, and displays the average percentage of busy time observed during the sample interval. It should be noted that the accounting calculation of whether the processor is idle is performed at an internal sampling interval of the system clock (10ms). On today's fast processors, % Processor Time can therefore underestimate the processor utilization as the processor may be spending much time servicing threads between the system clock sampling interval. Workload-based timer applications are one type application that is more likely to be measured inaccurately because timers are signaled just after the sample is taken. It's backed by performance counter data from the domain controller, and can be filtered or split by role instance. |
| Kerberos Authentications | The number of times that clients use a ticket to authenticate to this computer per second. It's backed by performance counter data from the domain controller, and can be filtered or split by role instance. |
| NTLM Authentications | The number of NTLM authentications processed per second for the Active Directory on this domain controller or for local accounts on this member server. It's backed by performance counter data from the domain controller, and can be filtered or split by role instance. |
| % Processor Time (dns) | The percentage of elapsed time that all of dns process threads used the processor to execute instructions. An instruction is the basic unit of execution in a computer, a thread is the object that executes instructions, and a process is the object created when a program is run. Code executed to handle some hardware interrupts and trap conditions are included in this count. It's backed by performance counter data from the domain controller, and can be filtered or split by role instance. |
| % Processor Time (lsass) | The percentage of elapsed time that all of lsass process threads used the processor to execute instructions. An instruction is the basic unit of execution in a computer, a thread is the object that executes instructions, and a process is the object created when a program is run. Code executed to handle some hardware interrupts and trap conditions are included in this count. It's backed by performance counter data from the domain controller, and can be filtered or split by role instance. |
| NTDS - LDAP Searches/sec | The average number of searches per second for the NTDS object. It's backed by performance counter data from the domain controller, and can be filtered or split by role instance. |
Azure Monitor alert
You can configure metric alerts for Domain Services to be notified of possible problems. Metric alerts are one type of alert for Azure Monitor. For more information about other types of alerts, see What are Azure Monitor Alerts?.
To view and manage Azure Monitor alert, a user needs to be assigned Azure Monitor roles.
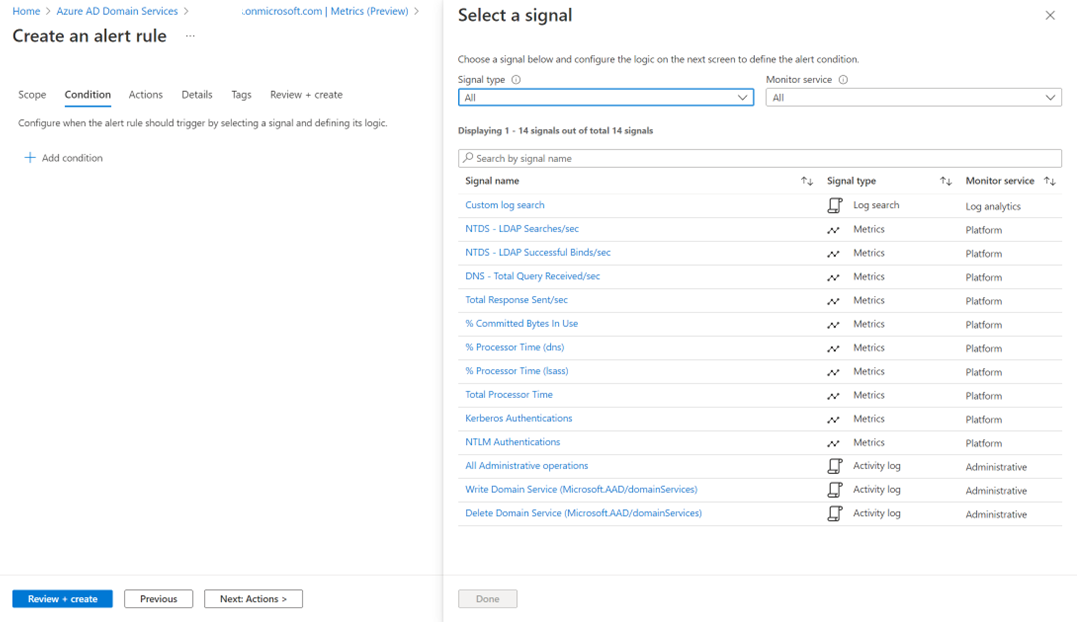
In Azure Monitor or Domain Services Metrics, click New alert and configure a Domain Services instance as the scope. Then choose the metrics you want to measure from the list of available signals:
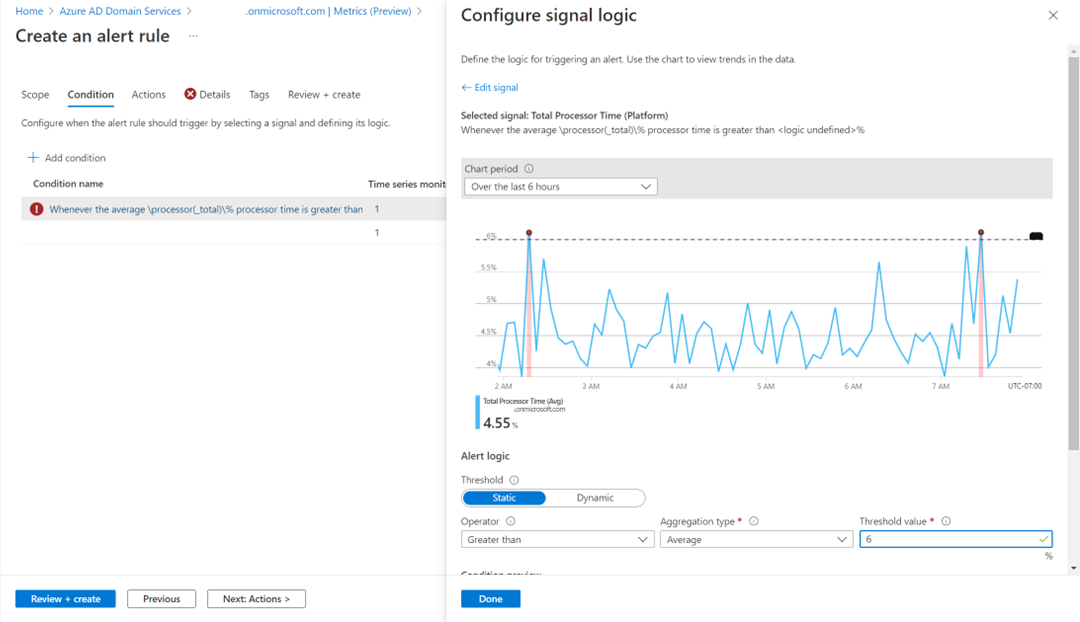
The following screenshot shows how to define a metric alert with a threshold for Total Processor Time:
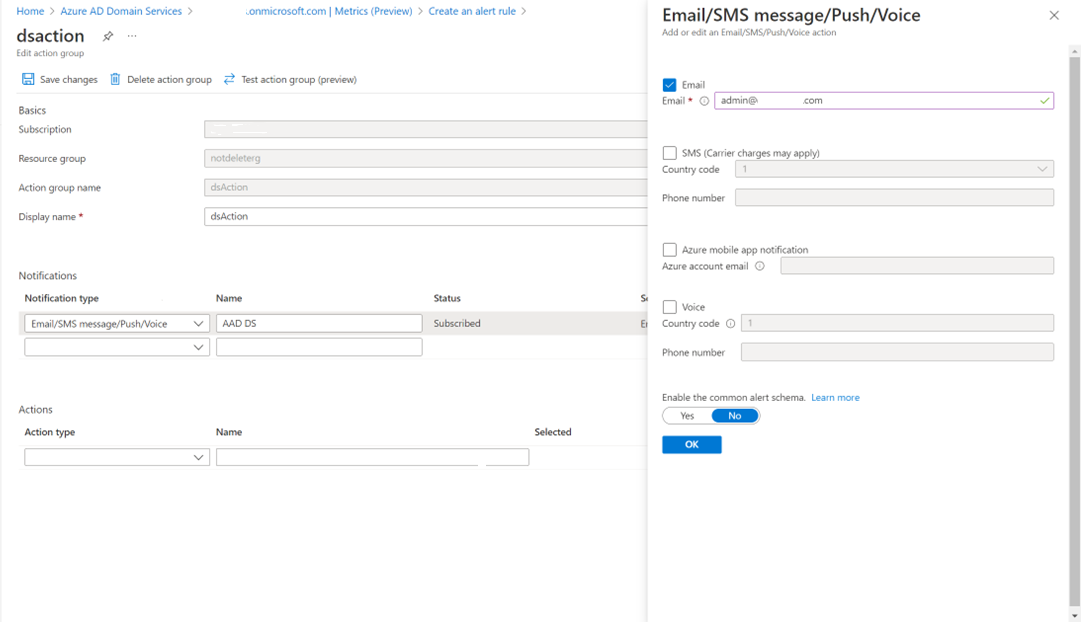
You can also configure an alert notification, which can be email, SMS, or voice call:
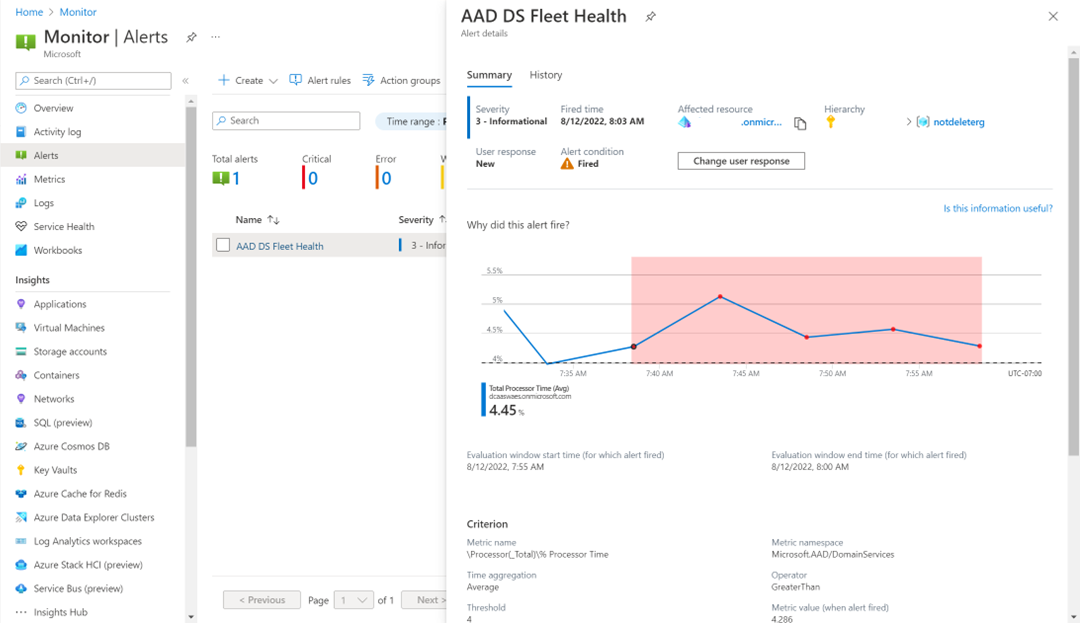
The following screenshot shows a metrics alert triggered for Total Processor Time:
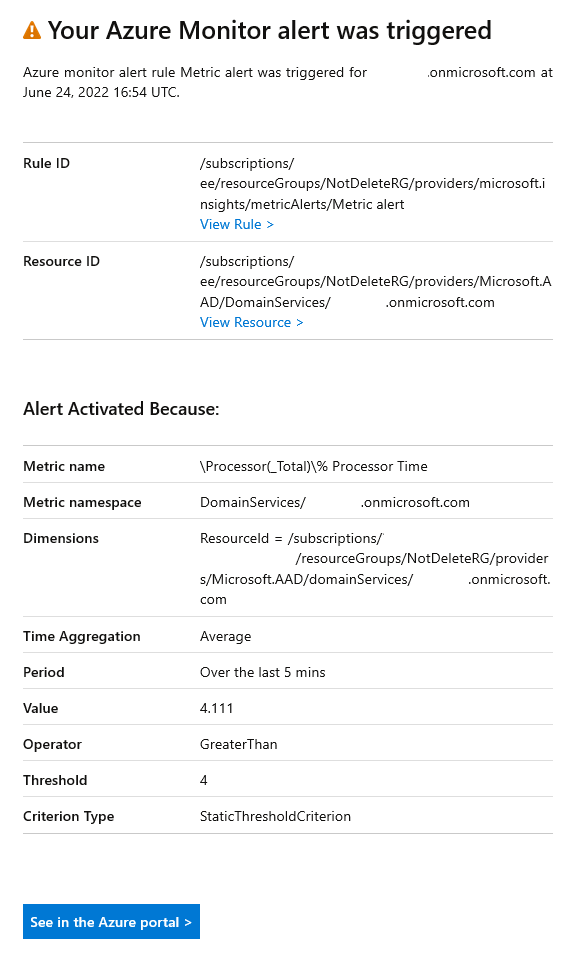
In this case, an email notification is sent after an alert activation:
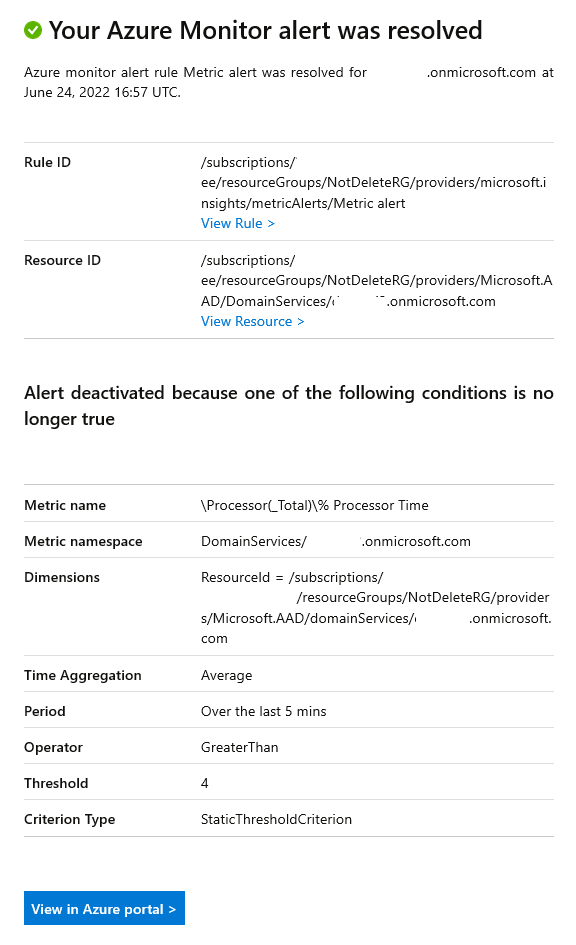
Another email notification is sent after deactivation of the alert:
Select multiple resources
You can upvote to enable multiple resource selection to correlate data between resource types.

Next steps
Feedback
Coming soon: Throughout 2024 we will be phasing out GitHub Issues as the feedback mechanism for content and replacing it with a new feedback system. For more information see: https://aka.ms/ContentUserFeedback.
Submit and view feedback for