Monitoring application sign-in health for resilience
To increase infrastructure resilience, set up monitoring of application sign-in health for your critical applications. You can receive an alert when an affecting incident occurs. This article walks through setting up the App sign-in health workbook to monitor for disruptions to your users' sign-ins.
You can configure alerts based on the App sign-in health workbook. This workbook enables administrators to monitor authentication requests for applications in their tenants. It provides these key capabilities:
- Configure the workbook to monitor all or individual apps with near real-time data.
- Configure alerts for authentication pattern changes so that you can investigate and respond.
- Compare trends over a period of time. Week over week is the workbook's default setting.
Note
See all available workbooks and the prerequisites for using them in How to use Azure Monitor workbooks for reports.
During an affecting event, two things might happen:
- The number of sign-ins for an application may abruptly drop when users can't sign in.
- The number of sign-in failures might increase.
Prerequisites
- A Microsoft Entra tenant.
- A user with Global Administrator or Security Administrator role for the Microsoft Entra tenant.
- A Log Analytics workspace in your Azure subscription to send logs to Azure Monitor logs. Learn how to create a Log Analytics workspace.
- Microsoft Entra logs integrated with Azure Monitor logs. Learn how to Integrate Microsoft Entra sign-in logs with Azure Monitor Stream.
Configure the App sign-in health workbook
To access workbooks in the Azure portal, select Microsoft Entra ID, select Workbooks. The following screenshot shows the Workbooks Gallery in the Azure portal.
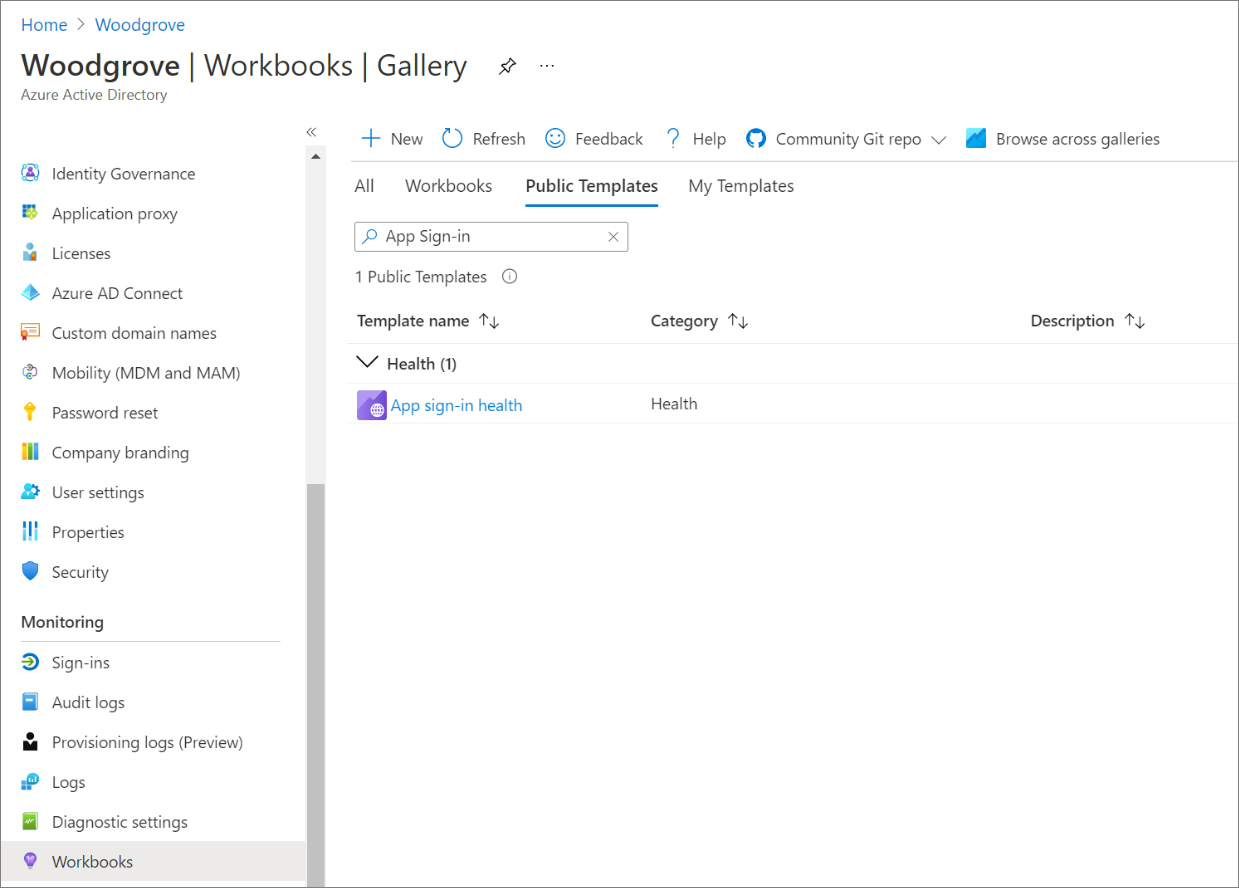
Workbooks appear under Usage, Conditional Access, and Troubleshoot. The App sign in health workbook appears in the Health section. After you use a workbook, it might appear in the Recently modified workbooks section.
You can use the App sign-in health workbook to visualize what is happening with your sign-ins. As shown in the following screenshot, the workbook presents two graphs.
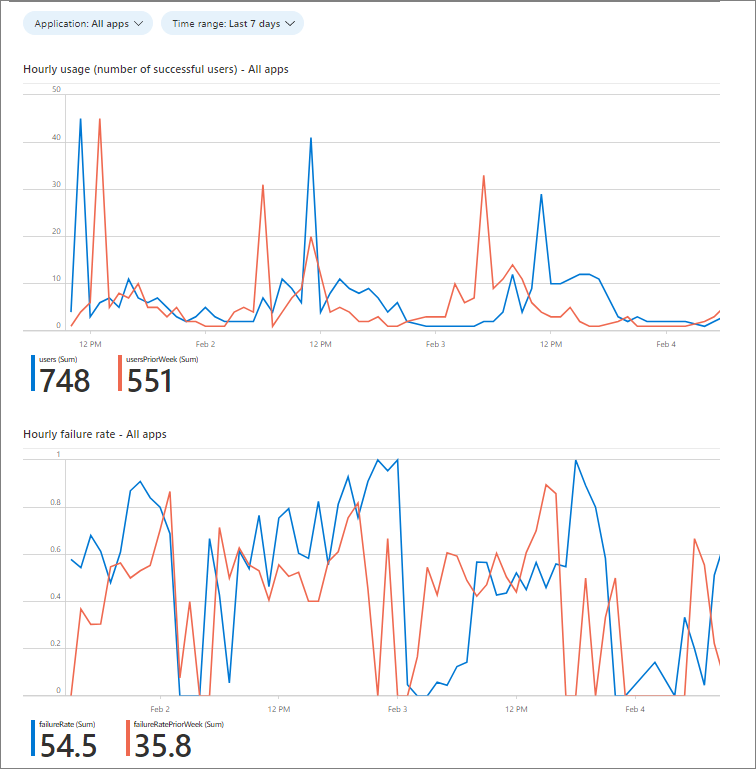
In the preceding screenshot, there are two graphs:
- Hourly usage (number of successful users). Comparing your current number of successful users to a typical usage period helps you to spot a drop in usage that might require investigation. A drop-in successful usage rate can help detect performance and utilization issues that the failure rate can't detect. For example, when users can't reach your application to attempt to sign in, there's a drop in usage but no failures. See the sample query for this data in the next section of this article.
- Hourly failure rate. A spike in failure rate might indicate an issue with your authentication mechanisms. Failure rate measures only appear when users can attempt to authenticate. When users can't gain access to make the attempt, there are no failures.
Configure the query and alerts
You create alert rules in Azure Monitor and can automatically run saved queries or custom log searches at regular intervals. You can configure an alert that notifies a specific group when the usage or failure rate exceeds a specified threshold.
Use the following instructions to create email alerts based on the queries reflected in the graphs. The sample scripts send an email notification when:
- The successful usage drops by 90% from the same hour two days ago, as shown in the preceding hourly usage graph example.
- The failure rate increases by 90% from the same hour two days ago, as shown in the preceding hourly failure rate graph example.
To configure the underlying query and set alerts, complete the following steps using the sample query as the basis for your configuration. The query structure description appears at the end of this section. Learn how to create, view, and manage log alerts using Azure Monitor in Manage log alerts.
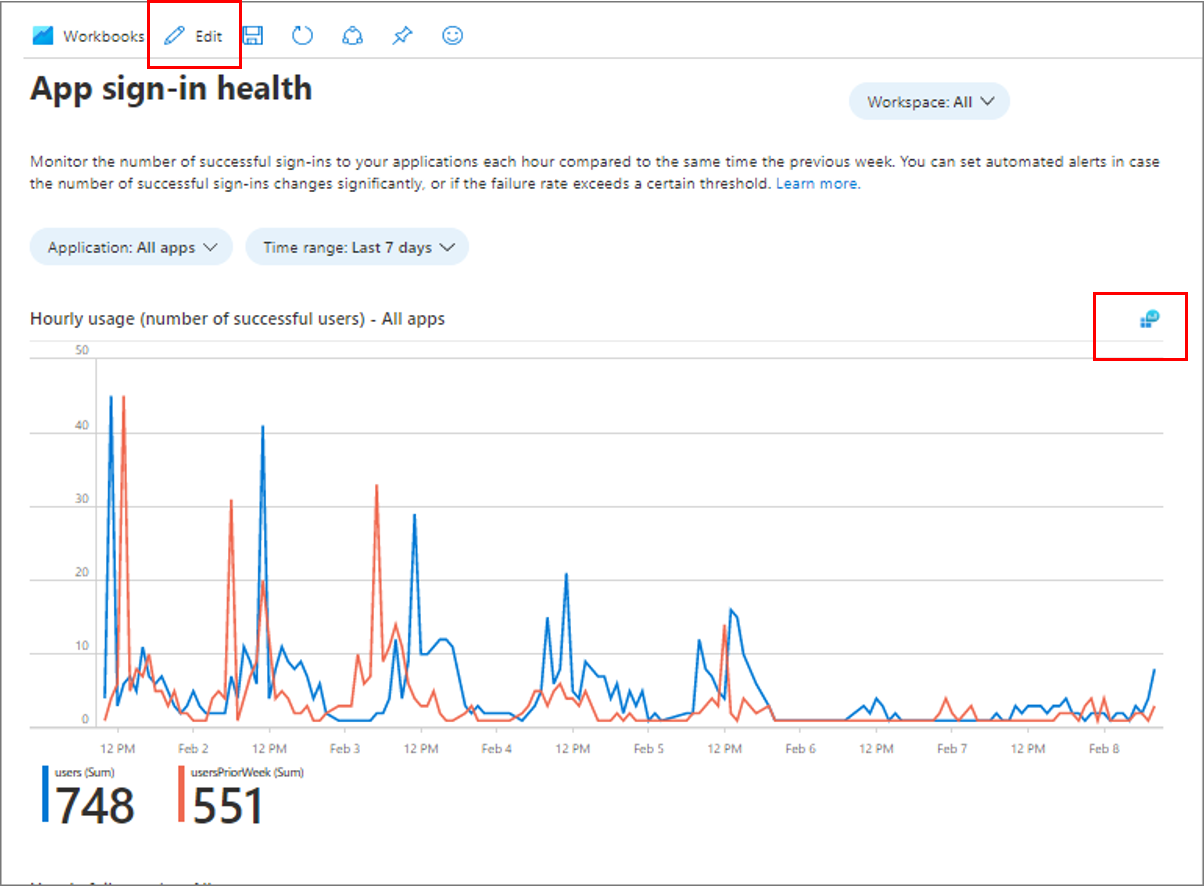
In the workbook, select Edit as shown in the following screenshot. Select the query icon in the upper right corner of the graph.
View the query log as shown in the following screenshot.
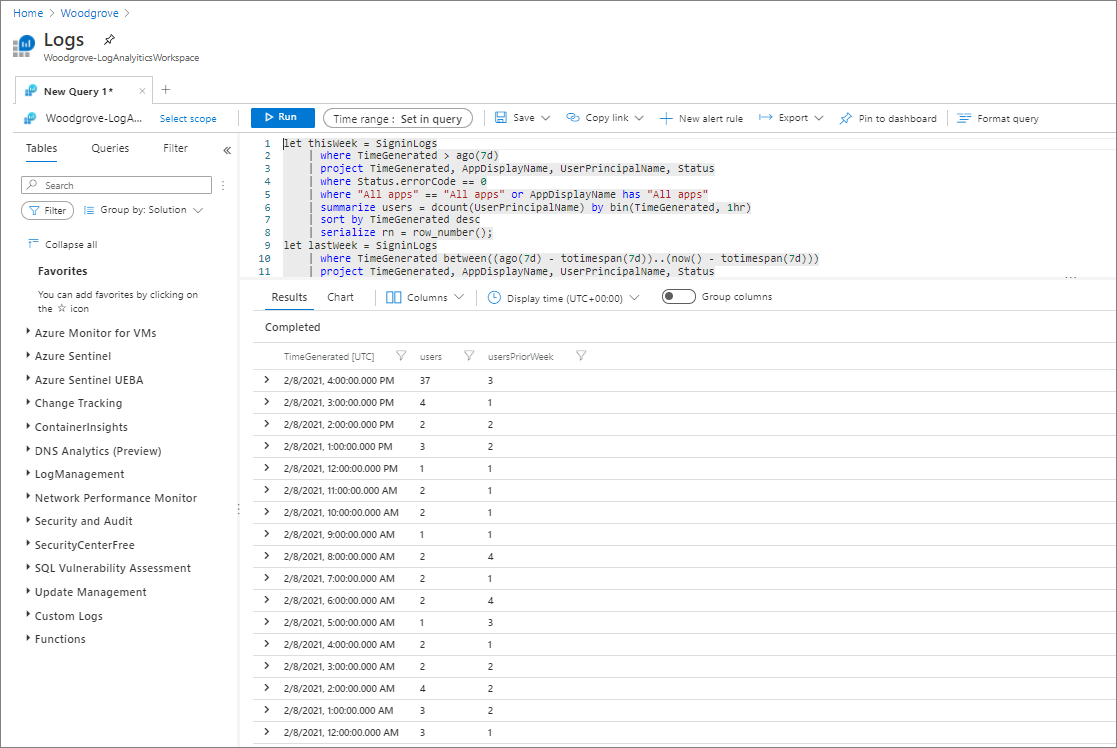
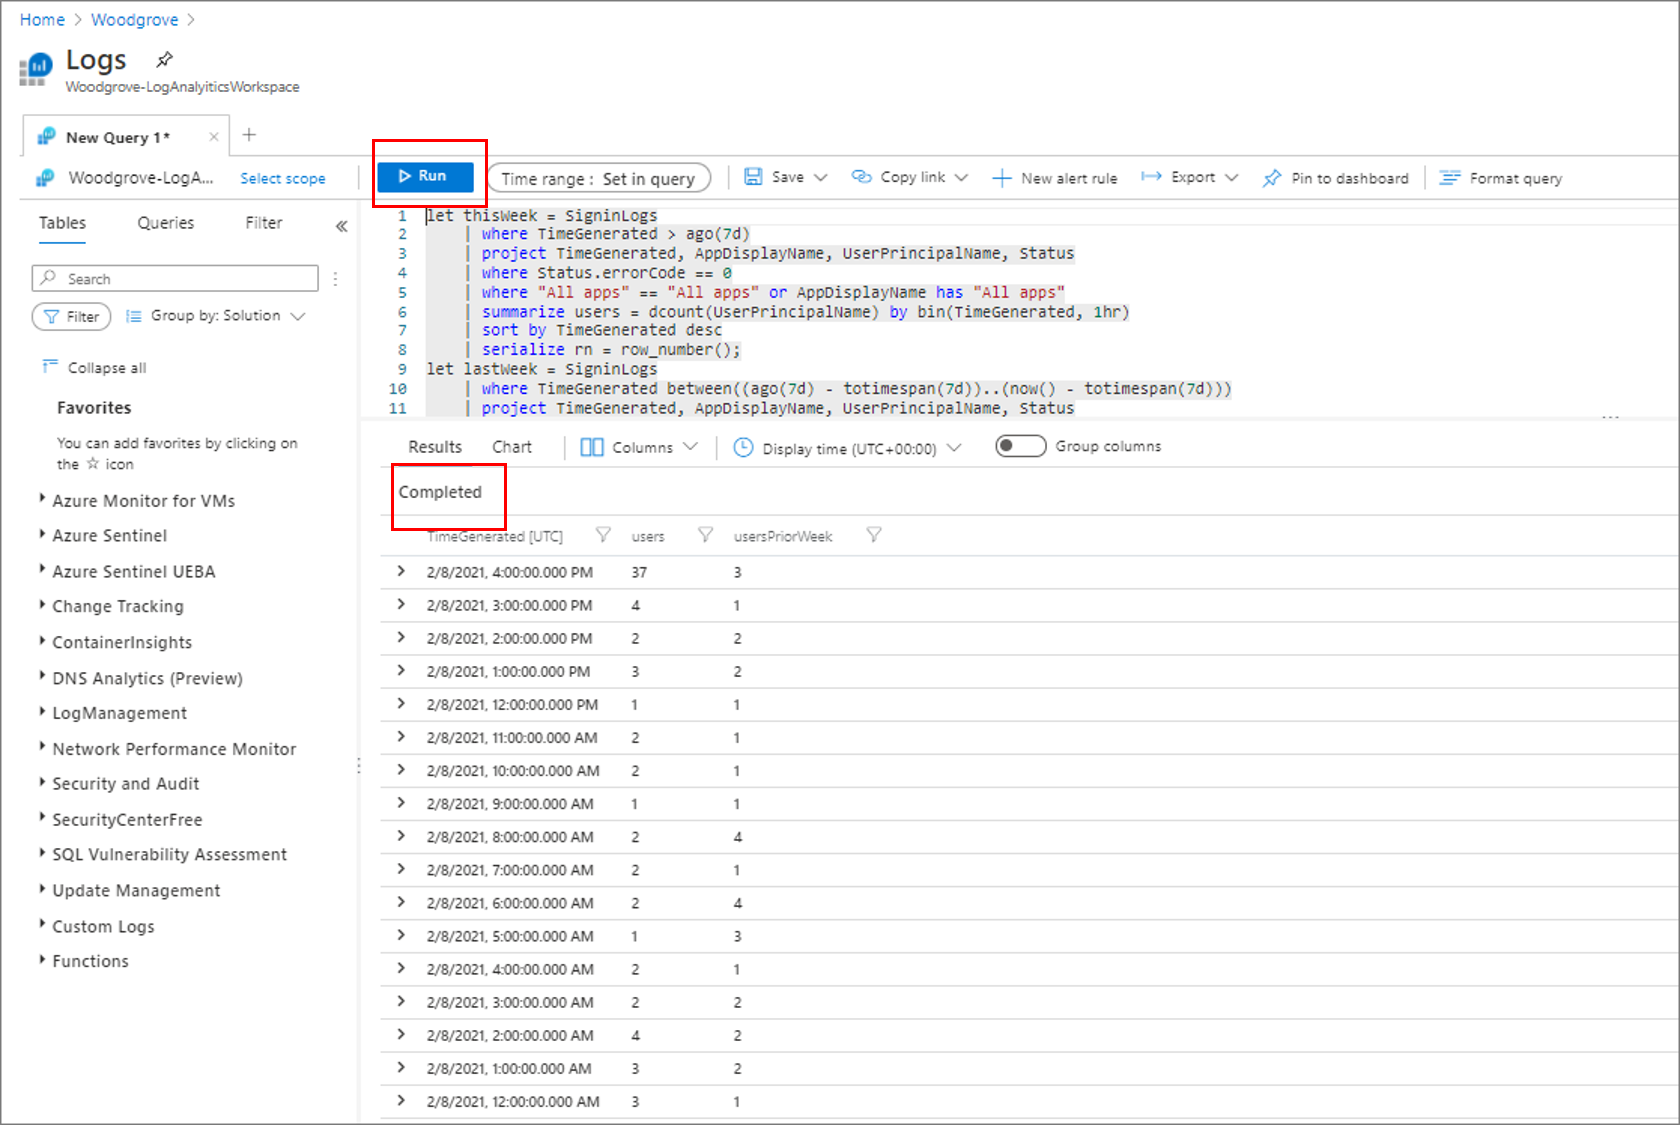
Copy one of the following sample scripts for a new Kusto query.
Paste the query in the window. Select Run. Look for the Completed message and the query results as shown in the following screenshot.
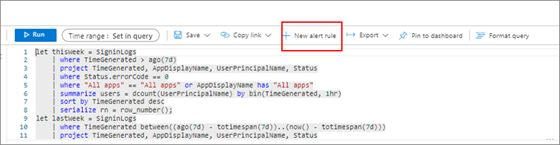
Highlight the query. Select + New alert rule.
Configure alert conditions. As shown in the following example screenshot, in the Condition section, under Measurement, select Table rows for Measure. Select Count for Aggregation type. Select 2 days for Aggregation granularity.
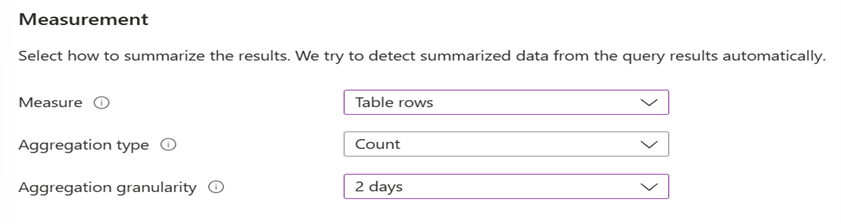
- Table rows. You can use the number of rows returned to work with events such as Windows event logs, Syslog, and application exceptions.
- Aggregation type. Data points applied with Count.
- Aggregation granularity. This value defines the period that works with Frequency of evaluation.
In Alert Logic, configure the parameters as shown in the example screenshot.
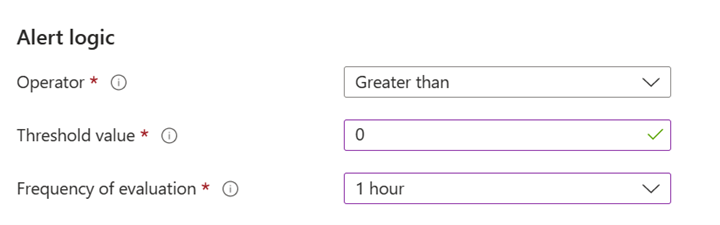
- Threshold value: 0. This value alerts on any results.
- Frequency of evaluation: 1 hour. This value sets the evaluation period to once per hour for the previous hour.
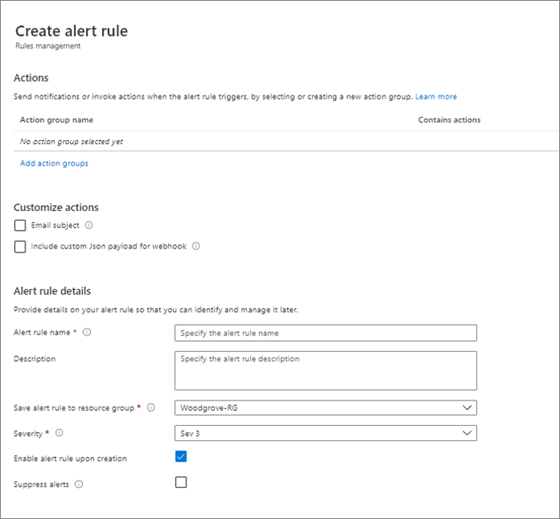
In the Actions section, configure settings as shown in the example screenshot.
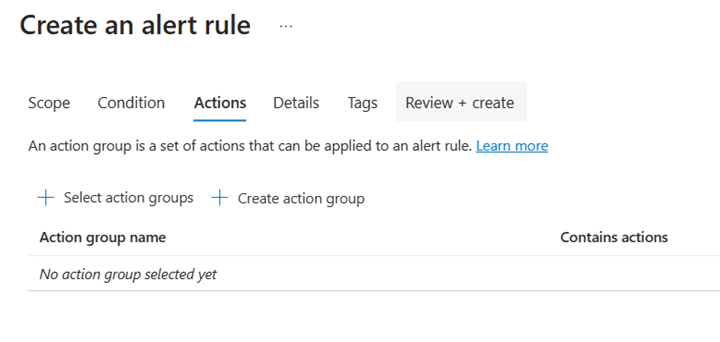
- Select Select action group and add the group for which you want alert notifications.
- Under Customize actions, select Email alerts.
- Add a subject line.
In the Details section, configure settings as shown in the example screenshot.
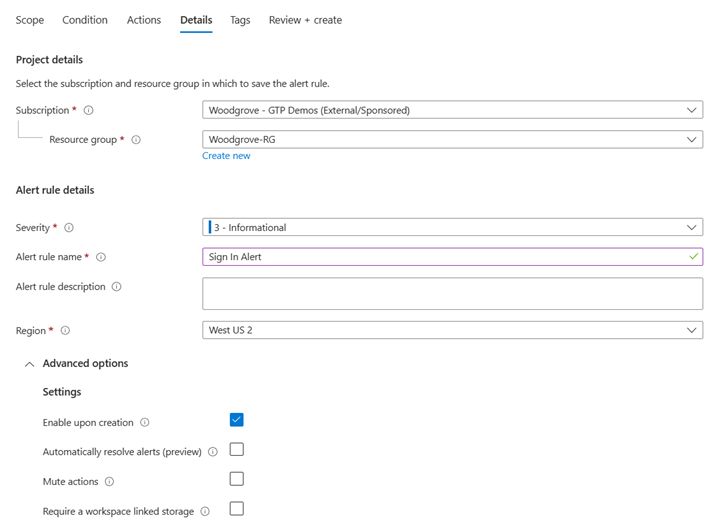
- Add a Subscription name and a description.
- Select the Resource group to which you want to add the alert.
- Select the default Severity.
- Select Enable upon creation if you want it to immediately go live. Otherwise, select Mute actions.
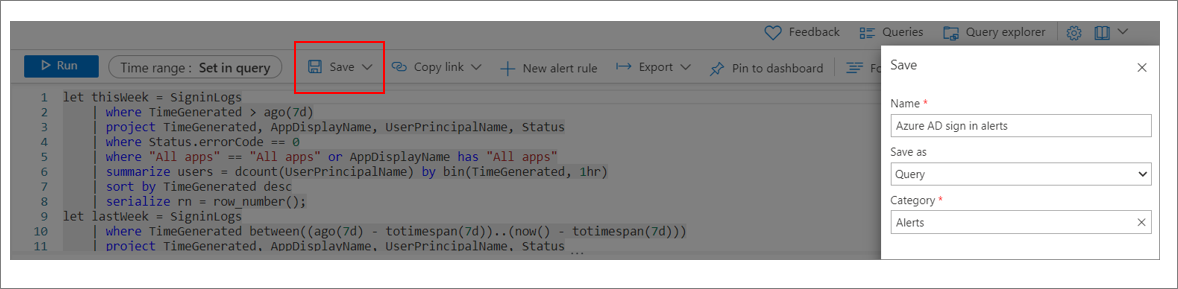
In the Review + create section, configure settings as shown in the example screenshot.
Select Save. Enter a name for the query. For Save as, select Query. For Category, select Alert. Again, select Save.
Refine your queries and alerts
To modify your queries and alerts for maximum effectiveness:
- Always test alerts.
- Modify alert sensitivity and frequency to receive important notifications. Admins can become desensitized to alerts and miss something important if they get too many.
- In administrator's email clients, add the email from which alerts come to the allowed senders list. This approach prevents missed notifications due to a spam filter on their email clients.
- By design, alert queries in Azure Monitor can only include results from the past 48 hours.
Sample scripts
Kusto query for increase in failure rate
In the following query, we detect increasing failure rates. As necessary, you can adjust the ratio at the bottom. It represents the percent change in traffic in the last hour as compared to yesterday's traffic at same time. A 0.5 result indicates a 50% difference in the traffic.
let today = SigninLogs
| where TimeGenerated > ago(1h) // Query failure rate in the last hour
| project TimeGenerated, UserPrincipalName, AppDisplayName, status = case(Status.errorCode == "0", "success", "failure")
// Optionally filter by a specific application
//| where AppDisplayName == **APP NAME**
| summarize success = countif(status == "success"), failure = countif(status == "failure") by bin(TimeGenerated, 1h) // hourly failure rate
| project TimeGenerated, failureRate = (failure * 1.0) / ((failure + success) * 1.0)
| sort by TimeGenerated desc
| serialize rowNumber = row_number();
let yesterday = SigninLogs
| where TimeGenerated between((ago(1h) – totimespan(1d))..(now() – totimespan(1d))) // Query failure rate at the same time yesterday
| project TimeGenerated, UserPrincipalName, AppDisplayName, status = case(Status.errorCode == "0", "success", "failure")
// Optionally filter by a specific application
//| where AppDisplayName == **APP NAME**
| summarize success = countif(status == "success"), failure = countif(status == "failure") by bin(TimeGenerated, 1h) // hourly failure rate at same time yesterday
| project TimeGenerated, failureRateYesterday = (failure * 1.0) / ((failure + success) * 1.0)
| sort by TimeGenerated desc
| serialize rowNumber = row_number();
today
| join (yesterday) on rowNumber // join data from same time today and yesterday
| project TimeGenerated, failureRate, failureRateYesterday
// Set threshold to be the percent difference in failure rate in the last hour as compared to the same time yesterday
// Day variable is the number of days since the previous Sunday. Optionally ignore results on Sat, Sun, and Mon because large variability in traffic is expected.
| extend day = dayofweek(now())
| where day != time(6.00:00:00) // exclude Sat
| where day != time(0.00:00:00) // exclude Sun
| where day != time(1.00:00:00) // exclude Mon
| where abs(failureRate – failureRateYesterday) > 0.5
Kusto query for drop in usage
In the following query, we compare traffic in the last hour to yesterday's traffic at the same time. We exclude Saturday, Sunday, and Monday because we expect large variability in the previous day's traffic at the same time.
As necessary, you can adjust the ratio at the bottom. It represents the percent change in traffic in the last hour as compared to yesterday's traffic at same time. A 0.5 result indicates a 50% difference in the traffic. Adjust these values to fit your business operation model.
Let today = SigninLogs // Query traffic in the last hour
| where TimeGenerated > ago(1h)
| project TimeGenerated, AppDisplayName, UserPrincipalName
// Optionally filter by AppDisplayName to scope query to a single application
//| where AppDisplayName contains "Office 365 Exchange Online"
| summarize users = dcount(UserPrincipalName) by bin(TimeGenerated, 1hr) // Count distinct users in the last hour
| sort by TimeGenerated desc
| serialize rn = row_number();
let yesterday = SigninLogs // Query traffic at the same hour yesterday
| where TimeGenerated between((ago(1h) – totimespan(1d))..(now() – totimespan(1d))) // Count distinct users in the same hour yesterday
| project TimeGenerated, AppDisplayName, UserPrincipalName
// Optionally filter by AppDisplayName to scope query to a single application
//| where AppDisplayName contains "Office 365 Exchange Online"
| summarize usersYesterday = dcount(UserPrincipalName) by bin(TimeGenerated, 1hr)
| sort by TimeGenerated desc
| serialize rn = row_number();
today
| join // Join data from today and yesterday together
(
yesterday
)
on rn
// Calculate the difference in number of users in the last hour compared to the same time yesterday
| project TimeGenerated, users, usersYesterday, difference = abs(users – usersYesterday), max = max_of(users, usersYesterday)
| extend ratio = (difference * 1.0) / max // Ratio is the percent difference in traffic in the last hour as compared to the same time yesterday
// Day variable is the number of days since the previous Sunday. Optionally ignore results on Sat, Sun, and Mon because large variability in traffic is expected.
| extend day = dayofweek(now())
| where day != time(6.00:00:00) // exclude Sat
| where day != time(0.00:00:00) // exclude Sun
| where day != time(1.00:00:00) // exclude Mon
| where ratio > 0.7 // Threshold percent difference in sign-in traffic as compared to same hour yesterday
Create processes to manage alerts
After you set up queries and alerts, create business processes to manage the alerts.
- Who monitors the workbook and when?
- When alerts occur, who investigates them?
- What are the communication needs? Who creates the communications and who receives them?
- When an outage occurs, what business processes apply?
Next steps
Learn more about workbooks
Feedback
Coming soon: Throughout 2024 we will be phasing out GitHub Issues as the feedback mechanism for content and replacing it with a new feedback system. For more information see: https://aka.ms/ContentUserFeedback.
Submit and view feedback for