Visualize API Management monitoring data using a Managed Grafana dashboard
APPLIES TO: Developer | Basic | Basic v2 | Standard | Standard v2 | Premium
You can use Azure Managed Grafana to visualize API Management monitoring data that is collected into a Log Analytics workspace. Use a prebuilt API Management dashboard for real-time visualization of logs and metrics collected from your API Management instance.
Prerequisites
API Management instance
To visualize resource logs and metrics for API Management, configure diagnostic settings to collect resource logs and send them to a Log Analytics workspace
To visualize detailed data about requests to the API Management gateway, integrate your API Management instance with Application Insights.
Note
To visualize data in a single dashboard, configure the Log Analytics workspace for the diagnostic settings and the Application Insights instance in the same resource group as your API Management instance.
Managed Grafana workspace
To create a Managed Grafana instance and workspace, see the quickstart for the portal or the Azure CLI.
The Managed Grafana instance must be in the same subscription as the API Management instance.
When created, the Grafana workspace is automatically assigned a Microsoft Entra managed identity, which is assigned the Monitor Reader role on the subscription. This gives you immediate access to Azure Monitor from the new Grafana workspace without needing to set permissions manually. Learn more about configuring data sources for Managed Grafana.
Import API Management dashboard
First import the API Management dashboard to your Management Grafana workspace.
To import the dashboard:
- Go to your Azure Managed Grafana workspace. In the portal, on the Overview page of your Managed Grafana instance, select the Endpoint link.
- In the Managed Grafana workspace, go to Dashboards > Browse > Import.
- On the Import page, under Import via grafana.com, enter 16604 and select Load.
- Select an Azure Monitor data source, review or update the other options, and select Import.
Use API Management dashboard
- In the Managed Grafana workspace, go to Dashboards > Browse and select your API Management dashboard.
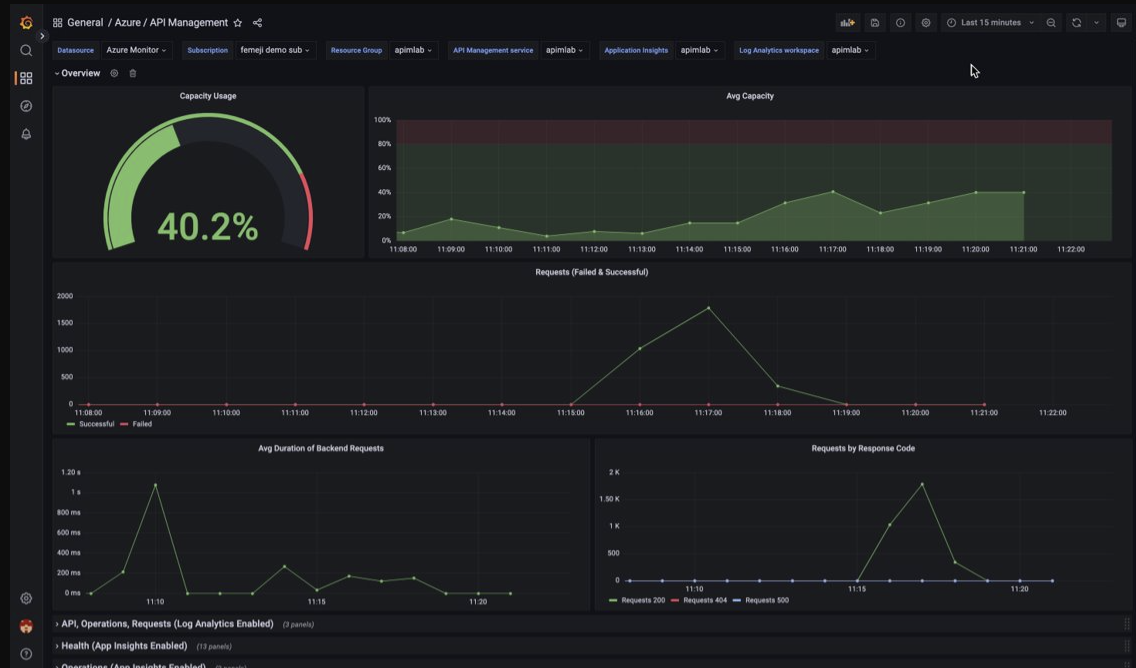
- In the dropdowns at the top, make selections for your API Management instance. If configured, select an Application Insights instance and a Log Analytics workspace.
Review the default visualizations on the dashboard, which will appear similar to the following screenshot:
Next steps
- For more information about managing your Grafana dashboard, see the Grafana docs.
- Easily pin log queries and charts from the Azure portal to your Managed Grafana dashboard. For more information, see Monitor your Azure services in Grafana.
Feedback
Coming soon: Throughout 2024 we will be phasing out GitHub Issues as the feedback mechanism for content and replacing it with a new feedback system. For more information see: https://aka.ms/ContentUserFeedback.
Submit and view feedback for
