Azure App Service diagnostics overview
When you’re running a web application, you want to be prepared for any issues that may arise, from 500 errors to your users telling you that your site is down. App Service diagnostics is an intelligent and interactive experience to help you troubleshoot your app with no configuration required. If you do run into issues with your app, App Service diagnostics points out what’s wrong to guide you to the right information to more easily and quickly troubleshoot and resolve the issue.
Although this experience is most helpful when you’re having issues with your app within the last 24 hours, all the diagnostic graphs are always available for you to analyze.
App Service diagnostics works for not only your app on Windows, but also apps on Linux/containers, App Service Environment, and Azure Functions.
Open App Service diagnostics
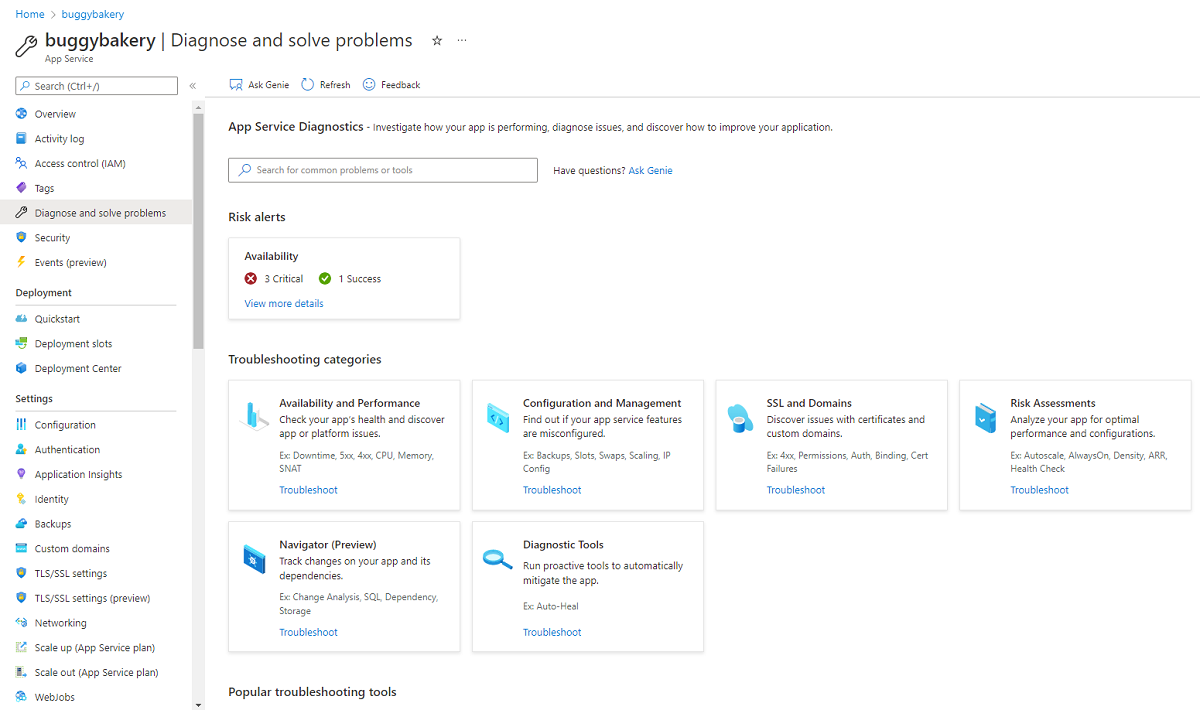
To access App Service diagnostics, navigate to your App Service web app or App Service Environment in the Azure portal. In the left navigation, click on Diagnose and solve problems.
For Azure Functions, navigate to your function app, and in the top navigation, click on Platform features, and select Diagnose and solve problems from the Resource management section.
In the App Service diagnostics homepage, you can perform a search for a symptom with your app, or choose a diagnostic category that best describes the issue with your app. Next, there is a new feature called Risk Alerts that provides an actionable report to improve your App. Finally, this page is where you can find Diagnostic Tools. See Diagnostic tools.
Note
If your app is down or performing slow, you can collect a profiling trace to identify the root cause of the issue. Profiling is light weight and is designed for production scenarios.
Diagnostic Interface
The homepage for App Service diagnostics offers streamlined diagnostics access using four sections:
- Ask Genie search box
- Risk Alerts
- Troubleshooting categories
- Popular troubleshooting tools
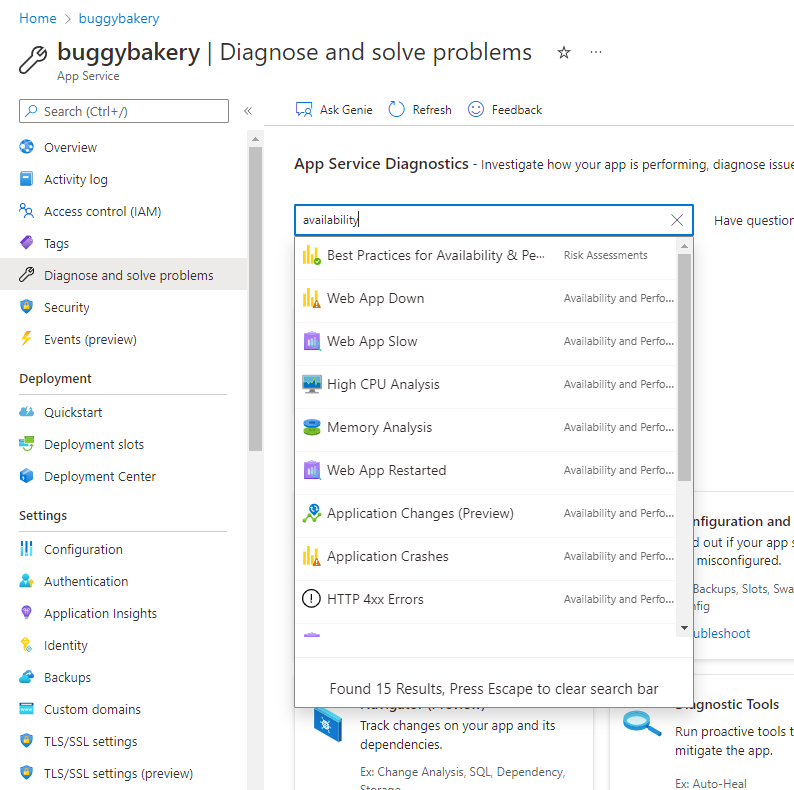
Ask Genie search box
The Genie search box is a quick way to find a diagnostic. The same diagnostic can be found through Troubleshooting categories.
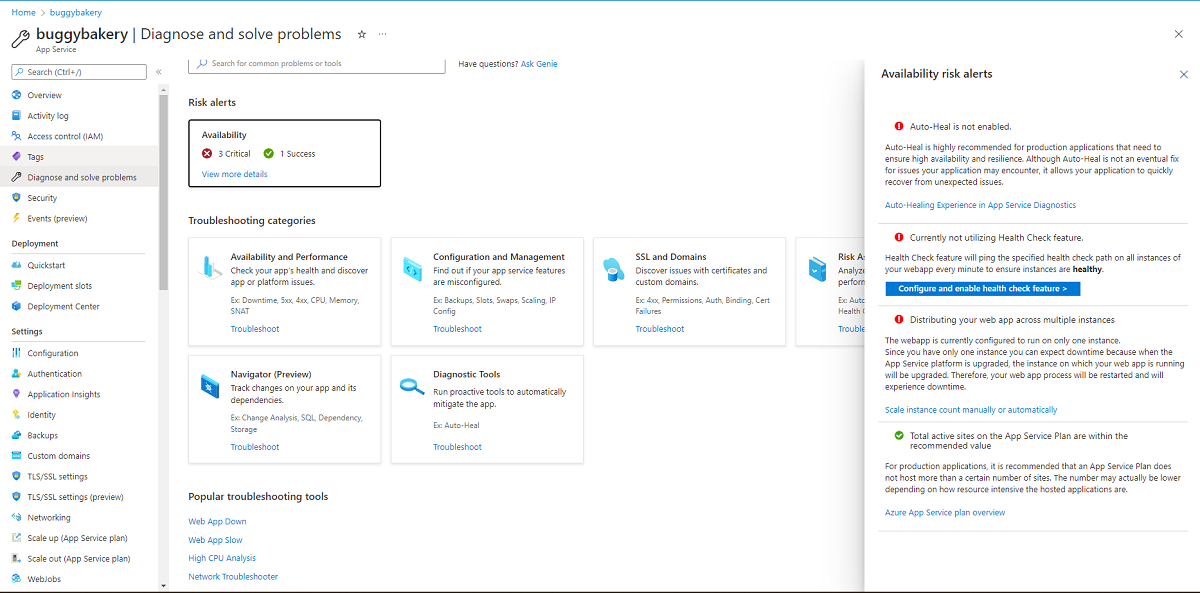
Risk Alerts
The App Service diagnostics homepage performs a series of configuration checks and offers recommendations based on your unique application's configuration.
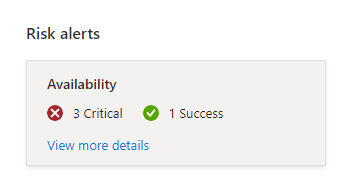
Recommendations and checks performed can be reviewed by clicking "View more details" link.
Troubleshooting categories
Troubleshooting categories group diagnostics for ease of discovery. The following are available:
- Availability and Performance
- Configuration and Management
- SSL and Domains
- Risk Assessments
- Navigator (Preview)
- Diagnostic Tools
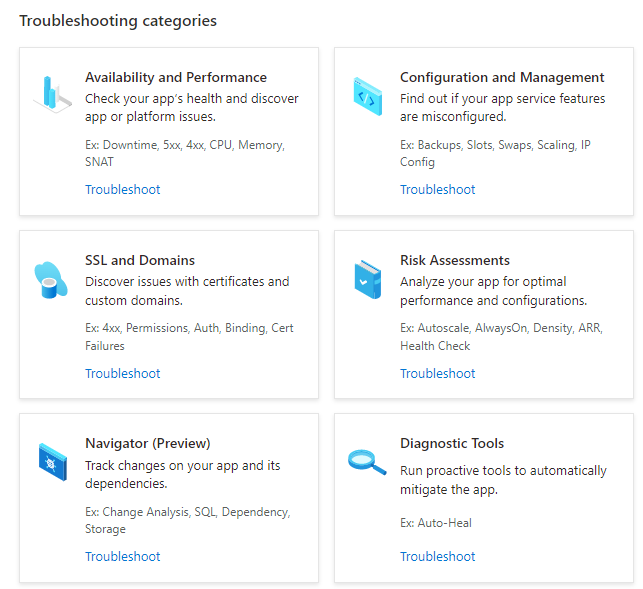
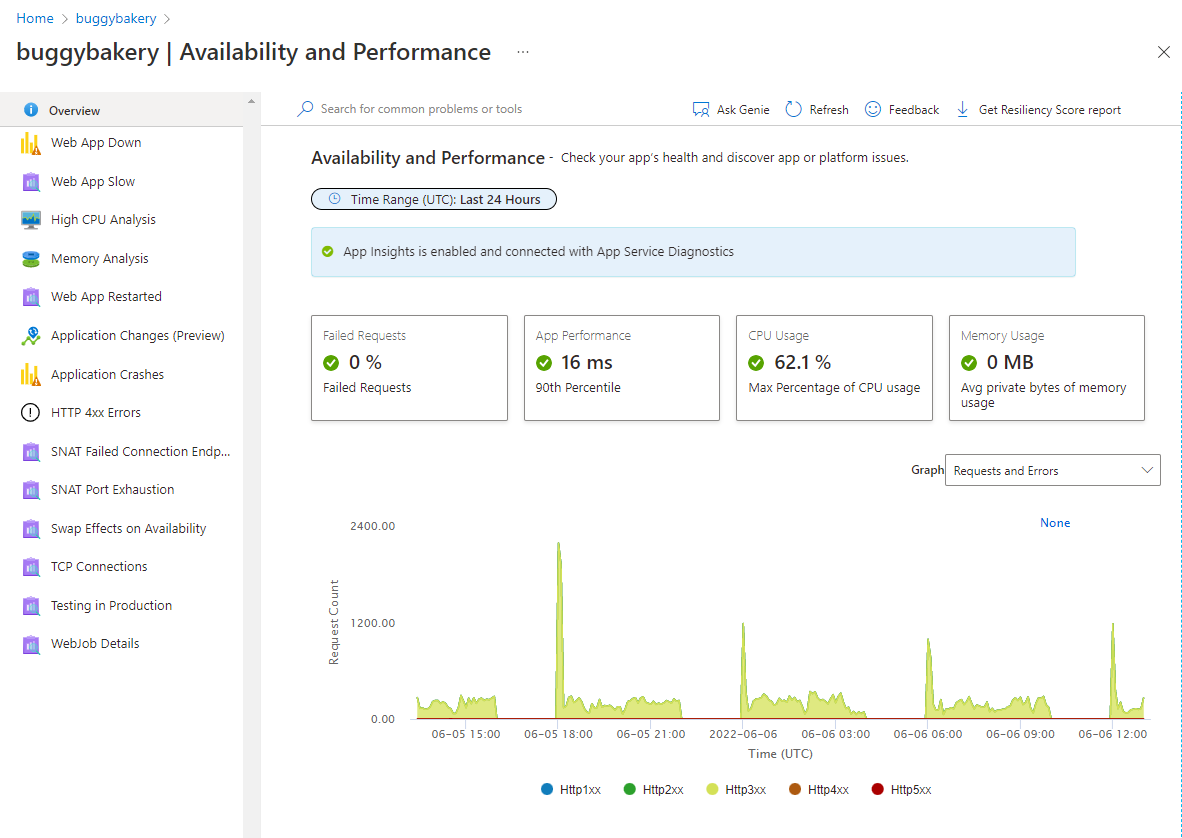
The tiles or the Troubleshoot link show the available diagnostics for the category. If you were interested in investigating Availability and performance the following diagnostics are offered:
- Overview
- Web App Down
- Web App Slow
- High CPU Analysis
- Memory Analysis
- Web App Restarted
- Application Change (Preview)
- Application Crashes
- HTTP 4xx Errors
- SNAT Failed Connection Endpoints
- SWAP Effects on Availability
- TCP Connections
- Testing in Production
- WebJob Details
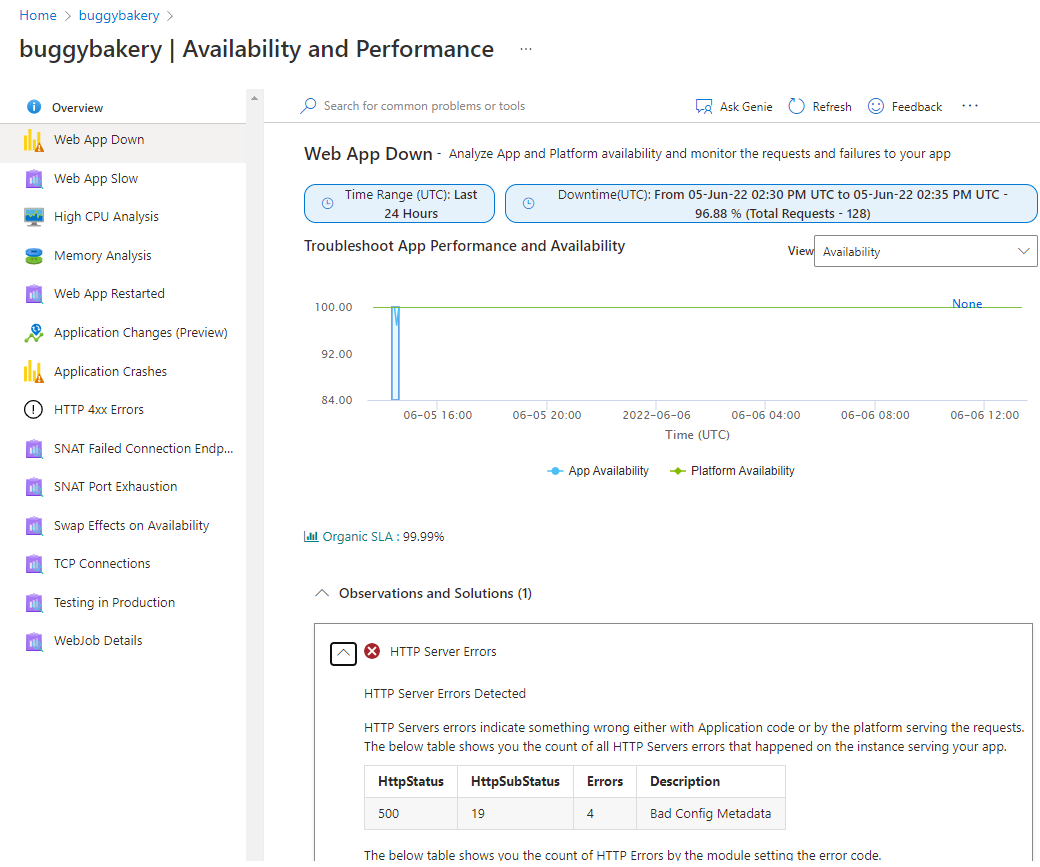
Diagnostic report
After you choose to investigate the issue further by clicking on a topic, you can view more details about the topic often supplemented with graphs and markdowns. Diagnostic report can be a powerful tool for pinpointing the problem with your app. The following is the Web App Down from Availability and Performance:
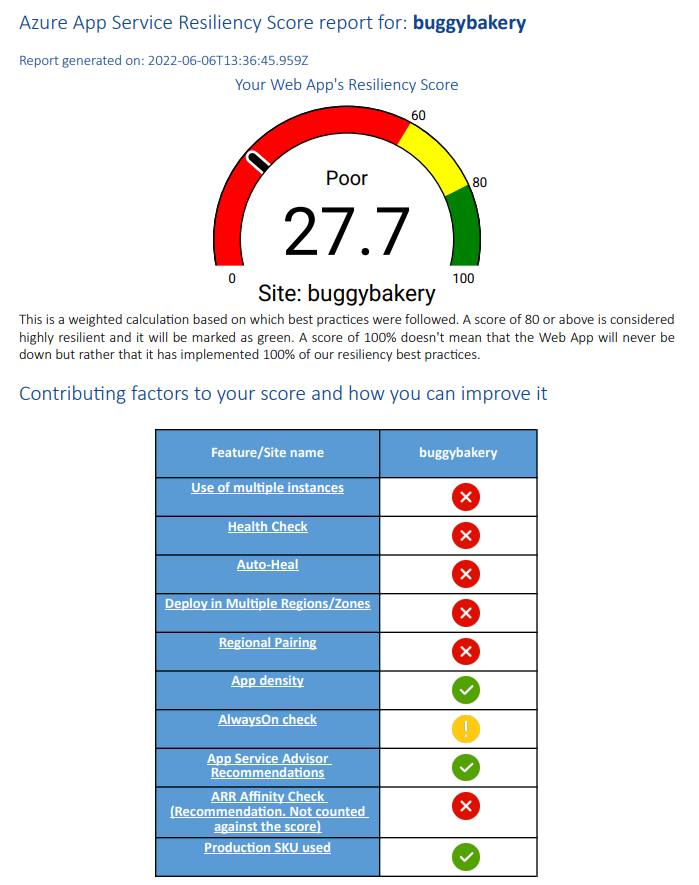
Resiliency Score
To review tailored best practice recommendations, check out the Resiliency Score Report. This is available as a downloadable PDF Report. To get it, simply click on the "Get Resilience Score report" button available on the command bar of any of the Troubleshooting categories.
Investigate application code issues (only for Windows app)
Because many app issues are related to issues in your application code, App Service diagnostics integrates with Application Insights to highlight exceptions and dependency issues to correlate with the selected downtime. Application Insights has to be enabled separately.
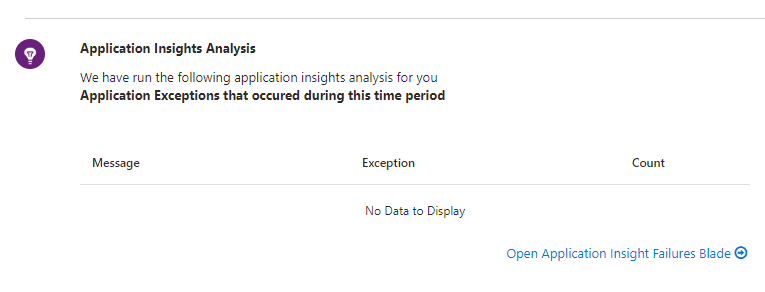
To view Application Insights exceptions and dependencies, select the web app down or web app slow tile shortcuts.
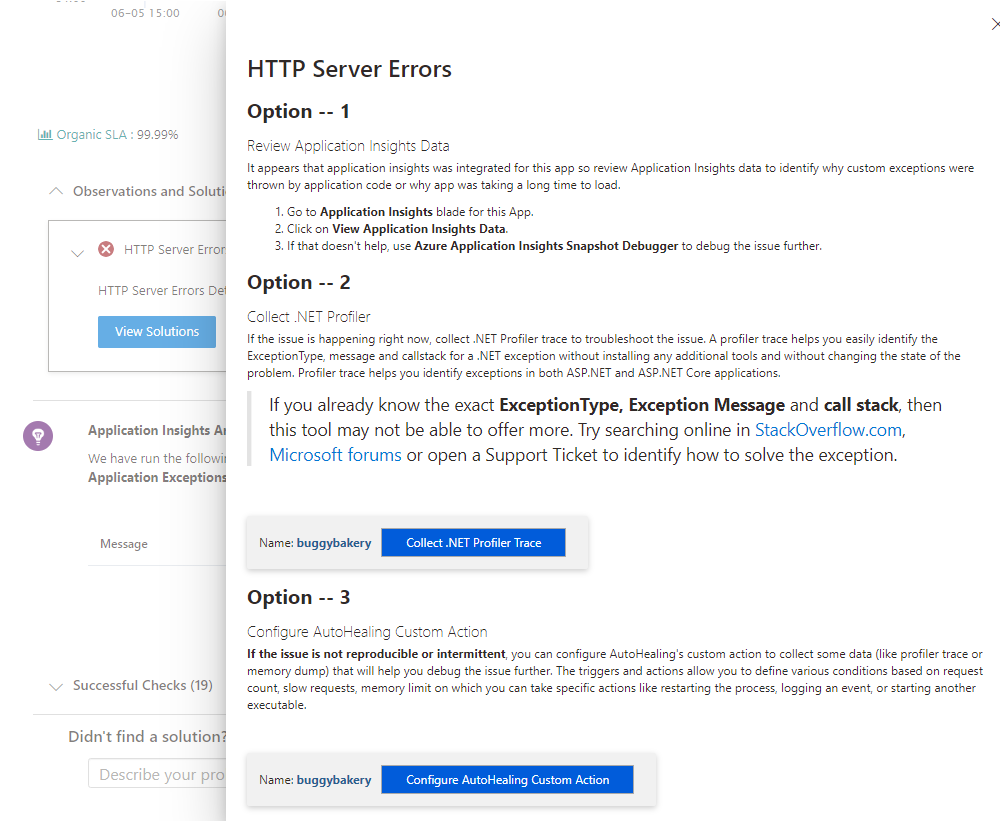
Troubleshooting steps
If an issue is detected with a specific problem category within the last 24 hours, you can view the full diagnostic report, and App Service diagnostics may prompt you to view more troubleshooting advice and next steps for a more guided experience.
Diagnostic tools
Diagnostics Tools include more advanced diagnostic tools that help you investigate application code issues, slowness, connection strings, and more. and proactive tools that help you mitigate issues with CPU usage, requests, and memory.
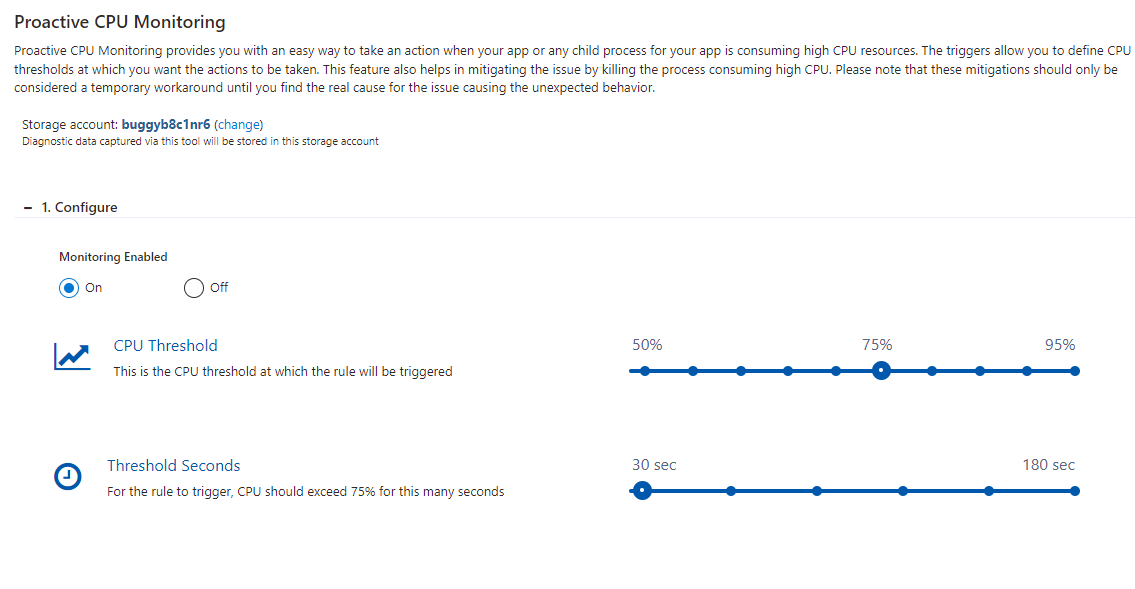
Proactive CPU monitoring (only for Windows app)
Proactive CPU monitoring provides you an easy, proactive way to take an action when your app or child process for your app is consuming high CPU resources. You can set your own CPU threshold rules to temporarily mitigate a high CPU issue until the real cause for the unexpected issue is found. For more information, see Mitigate your CPU problems before they happen.
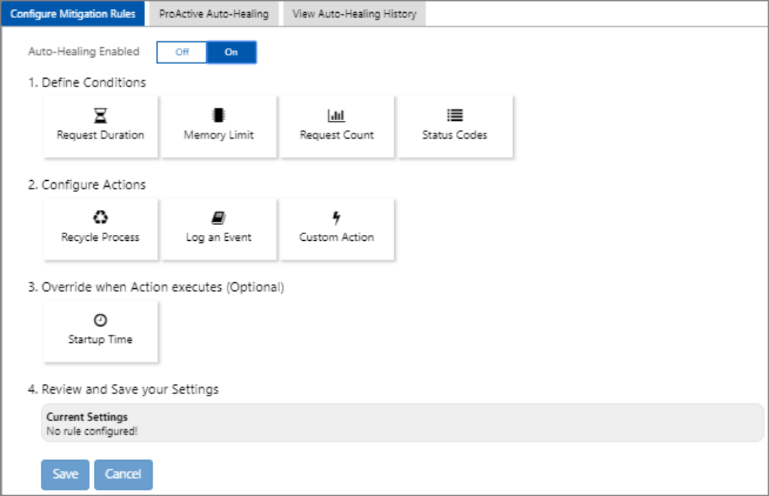
Auto-healing
Auto-healing is a mitigation action you can take when your app is having unexpected behavior. You can set your own rules based on request count, slow request, memory limit, and HTTP status code to trigger mitigation actions. Use the tool to temporarily mitigate an unexpected behavior until you find the root cause. The tool is currently available for Windows Web Apps, Linux Web Apps, and Linux Custom Containers. Supported conditions and mitigation vary depending on the type of the web app. For more information, see Announcing the new auto healing experience in app service diagnostics and Announcing Auto Heal for Linux.
Proactive auto-healing (only for Windows app)
Like proactive CPU monitoring, proactive auto-healing is a turn-key solution to mitigating unexpected behavior of your app. Proactive auto-healing restarts your app when App Service determines that your app is in an unrecoverable state. For more information, see Introducing Proactive Auto Heal.
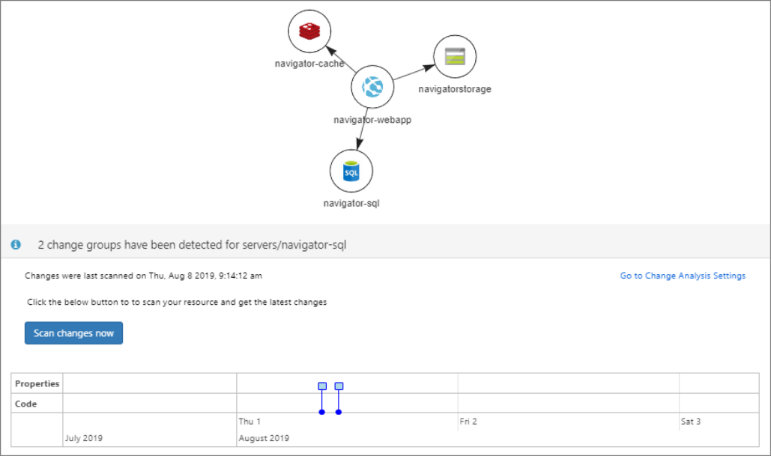
Navigator and change analysis (only for Windows app)
In a large team with continuous integration and where your app has many dependencies, it can be difficult to pinpoint the specific change that causes an unhealthy behavior. Navigator helps get visibility on your app’s topology by automatically rendering a dependency map of your app and all the resources in the same subscription. Navigator lets you view a consolidated list of changes made by your app and its dependencies and narrow down on a change causing unhealthy behavior. It can be accessed through the homepage tile Navigator and needs to be enabled before you use it the first time. For more information, see Get visibility into your app's dependencies with Navigator.
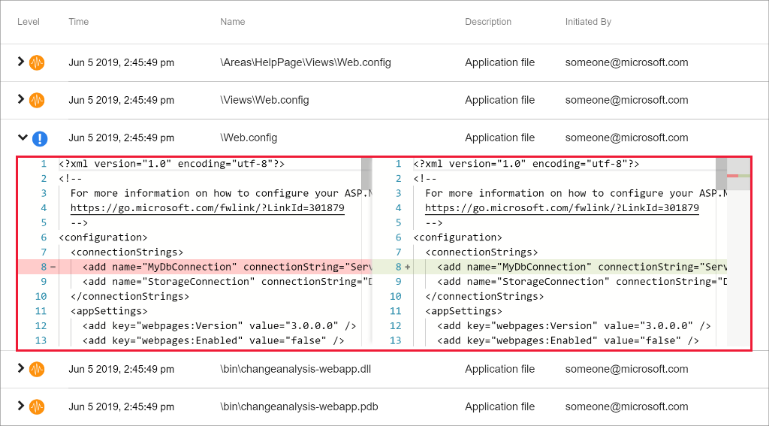
Change analysis for app changes can be accessed through tile shortcuts, Application Changes and Application Crashes in Availability and Performance so you can use it concurrently with other metrics. Before using the feature, you must first enable it. For more information, see Announcing the new change analysis experience in App Service Diagnostics.
Post your questions or feedback at UserVoice by adding "[Diag]" in the title.
More resources
Tutorial: Run a load test to identify performance bottlenecks in a web app
Feedback
Coming soon: Throughout 2024 we will be phasing out GitHub Issues as the feedback mechanism for content and replacing it with a new feedback system. For more information see: https://aka.ms/ContentUserFeedback.
Submit and view feedback for