Custom models: accuracy and confidence scores
This content applies to: ![]() v4.0 (preview)
v4.0 (preview) ![]() v3.1 (GA)
v3.1 (GA) ![]() v3.0 (GA)
v3.0 (GA) ![]() v2.1 (GA)
v2.1 (GA)
Note
- Custom neural models do not provide accuracy scores during training.
- Confidence scores for tables, table rows and table cells are available starting with the 2024-02-29-preview API version for custom models.
Custom template models generate an estimated accuracy score when trained. Documents analyzed with a custom model produce a confidence score for extracted fields. In this article, learn to interpret accuracy and confidence scores and best practices for using those scores to improve accuracy and confidence results.
Accuracy scores
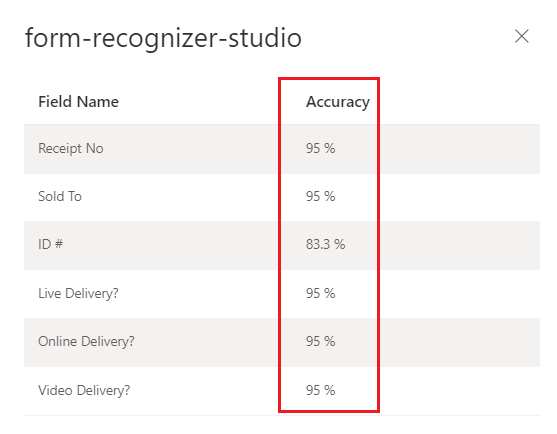
The output of a build (v3.0) or train (v2.1) custom model operation includes the estimated accuracy score. This score represents the model's ability to accurately predict the labeled value on a visually similar document.
The accuracy value range is a percentage between 0% (low) and 100% (high). The estimated accuracy is calculated by running a few different combinations of the training data to predict the labeled values.
Document Intelligence Studio
Trained custom model (invoice)
Confidence scores
Note
- Table, row and cell confidence scores are now included with the 2024-02-29-preview API version.
- Confidence scores for table cells from custom models is added to the API starting with the 2024-02-29-preview API.
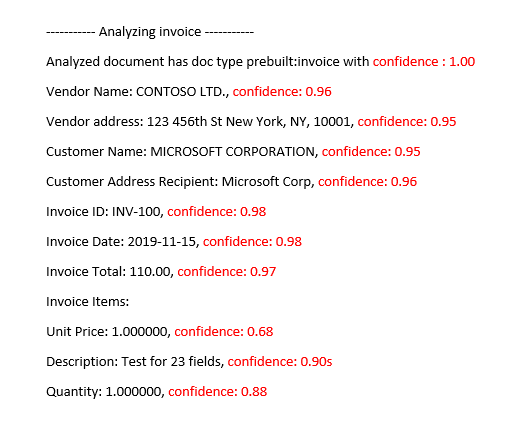
Document Intelligence analysis results return an estimated confidence for predicted words, key-value pairs, selection marks, regions, and signatures. Currently, not all document fields return a confidence score.
Field confidence indicates an estimated probability between 0 and 1 that the prediction is correct. For example, a confidence value of 0.95 (95%) indicates that the prediction is likely correct 19 out of 20 times. For scenarios where accuracy is critical, confidence can be used to determine whether to automatically accept the prediction or flag it for human review.
Document Intelligence Studio
Analyzed invoice prebuilt-invoice model
Interpret accuracy and confidence scores for custom models
When interpreting the confidence score from a custom model, you should consider all the confidence scores returned from the model. Let's start with a list of all the confidence scores.
- Document type confidence score: The document type confidence is an indicator of closely the analyzed document resembles documents in the training dataset. When the document type confidence is low, it's indicative of template or structural variations in the analyzed document. To improve the document type confidence, label a document with that specific variation and add it to your training dataset. Once the model is retrained, it should be better equipped to handle that class of variations.
- Field level confidence: Each labeled field extracted has an associated confidence score. This score reflects the model's confidence on the position of the value extracted. While evaluating confidence scores, you should also look at the underlying extraction confidence to generate a comprehensive confidence for the extracted result. Evaluate the
OCRresults for text extraction or selection marks depending on the field type to generate a composite confidence score for the field. - Word confidence score Each word extracted within the document has an associated confidence score. The score represents the confidence of the transcription. The pages array contains an array of words and each word has an associated span and confidence score. Spans from the custom field extracted values match the spans of the extracted words.
- Selection mark confidence score: The pages array also contains an array of selection marks. Each selection mark has a confidence score representing the confidence of the selection mark and selection state detection. When a labeled field has a selection mark, the custom field selection combined with the selection mark confidence is an accurate representation of overall confidence accuracy.
The following table demonstrates how to interpret both the accuracy and confidence scores to measure your custom model's performance.
| Accuracy | Confidence | Result |
|---|---|---|
| High | High | • The model is performing well with the labeled keys and document formats. • You have a balanced training dataset. |
| High | Low | • The analyzed document appears different from the training dataset. • The model would benefit from retraining with at least five more labeled documents. • These results could also indicate a format variation between the training dataset and the analyzed document. Consider adding a new model. |
| Low | High | • This result is most unlikely. • For low accuracy scores, add more labeled data or split visually distinct documents into multiple models. |
| Low | Low | • Add more labeled data. • Split visually distinct documents into multiple models. |
Table, row, and cell confidence
With the addition of table, row and cell confidence with the 2024-02-29-preview API, here are some common questions that should help with interpreting the table, row, and cell scores:
Q: Is it possible to see a high confidence score for cells, but a low confidence score for the row?
A: Yes. The different levels of table confidence (cell, row, and table) are meant to capture the correctness of a prediction at that specific level. A correctly predicted cell that belongs to a row with other possible misses would have high cell confidence, but the row's confidence should be low. Similarly, a correct row in a table with challenges with other rows would have high row confidence whereas the table's overall confidence would be low.
Q: What is the expected confidence score when cells are merged? Since a merge results in the number of columns identified to change, how are scores affected?
A: Regardless of the type of table, the expectation for merged cells is that they should have lower confidence values. Furthermore, the cell that is missing (because it was merged with an adjacent cell) should have NULL value with lower confidence as well. How much lower these values might be depends on the training dataset, the general trend of both merged and missing cell having lower scores should hold.
Q: What is the confidence score when a value is optional? Should you expect a cell with a NULL value and high confidence score if the value is missing?
A: If your training dataset is representative of the optionality of cells, it helps the model know how often a value tends to appear in the training set, and thus what to expect during inference. This feature is used when computing the confidence of either a prediction or of making no prediction at all (NULL). You should expect an empty field with high confidence for missing values that are mostly empty in the training set too.
Q: How are confidence scores affected if a field is optional and not present or missed? Is the expectation that the confidence score answers that question?
A: When a value is missing from a row, the cell has a NULL value and confidence assigned. A high confidence score here should mean that the model prediction (of there not being a value) is more likely to be correct. In contrast, a low score should signal more uncertainty from the model (and thus the possibility of an error, like the value being missed).
Q: What should be the expectation for cell confidence and row confidence when extracting a multi-page table with a row split across pages?
A: Expect the cell confidence to be high and row confidence to be potentially lower than rows that aren't split. The proportion of split rows in the training data set can affect the confidence score. In general, a split row looks different than the other rows in the table (thus, the model is less certain that it's correct).
Q: For cross-page tables with rows that cleanly end and start at the page boundaries, is it correct to assume that confidence scores are consistent across pages?
A: Yes. Since rows look similar in shape and contents, regardless of where they are in the document (or in which page), their respective confidence scores should be consistent.
Q: What is the best way to utilize the new confidence scores?
A: Look at all levels of table confidence starting in a top-to-bottom approach: begin by checking a table's confidence as a whole, then drill down to the row level and look at individual rows, finally look at cell-level confidences. Depending on the type of table, there are a couple of things of note:
For fixed tables, cell-level confidence already captures quite a bit of information on the correctness of things. This means that simply going over each cell and looking at its confidence can be enough to help determine the quality of the prediction. For dynamic tables, the levels are meant to build on top of each other, so the top-to-bottom approach is more important.
Ensure high model accuracy
Variances in the visual structure of your documents affect the accuracy of your model. Reported accuracy scores can be inconsistent when the analyzed documents differ from documents used in training. Keep in mind that a document set can look similar when viewed by humans but appear dissimilar to an AI model. To follow, is a list of the best practices for training models with the highest accuracy. Following these guidelines should produce a model with higher accuracy and confidence scores during analysis and reduce the number of documents flagged for human review.
Ensure that all variations of a document are included in the training dataset. Variations include different formats, for example, digital versus scanned PDFs.
Add at least five samples of each type to the training dataset if you expect the model to analyze both types of PDF documents.
Separate visually distinct document types to train different models.
- As a general rule, if you remove all user entered values and the documents look similar, you need to add more training data to the existing model.
- If the documents are dissimilar, split your training data into different folders and train a model for each variation. You can then compose the different variations into a single model.
Ensure that you don't have any extraneous labels.
Ensure that signature and region labeling doesn't include the surrounding text.
Next step
Feedback
Coming soon: Throughout 2024 we will be phasing out GitHub Issues as the feedback mechanism for content and replacing it with a new feedback system. For more information see: https://aka.ms/ContentUserFeedback.
Submit and view feedback for