Configure metrics and fine tune detection configuration
Important
Starting on the 20th of September, 2023 you won’t be able to create new Metrics Advisor resources. The Metrics Advisor service is being retired on the 1st of October, 2026.
Use this article to start configuring your Metrics Advisor instance using the web portal and fine-tune the anomaly detection results.
Metrics
To browse the metrics for a specific data feed, go to the Data feeds page and select one of the feeds. This will display a list of metrics associated with it.

Select one of the metric names to see its details. In this view, you can switch to another metric in the same data feed using the drop-down list in the top right corner of the screen.
When you first view a metric's details, you can load a time series by letting Metrics Advisor choose one for you, or by specifying values to be included for each dimension.
You can also select time ranges, and change the layout of the page.
Note
- The start time is inclusive.
- The end time is exclusive.
You can select the Incidents tab to view anomalies, and find a link to the Incident hub.
Tune the detection configuration
A metric can apply one or more detection configurations. There's a default configuration for each metric, which you can edit or add to, according to your monitoring needs.
Detection configuration auto-tuning based on anomaly preference
Detection configuration auto-tuning is a new feature released in Metrics Advisor, to help address the following scenarios:
Depending on the use case, certain types of anomalies may be of more significant interest. Sometimes you may be interested in sudden spikes or dips, but other cases, spikes/dips or transient anomalies aren't critical. Previously it was hard to distinguish the configuration for different anomaly types. The new auto-tuning feature makes this distinction between anomaly types possible. As of now, there are five supported anomaly patterns:
- Spike
- Dip
- Increase
- Decrease
- Steady
Sometimes, there may be many dimensions within one metric, which will split the metric into hundreds, thousands, or even more time series to be monitored. However, often some of these dimensions aren't equally important. Take revenue as an example, the number for small regions or a niche product category might be quite small and therefore also not that stable. But at the same time not necessarily critical. The new auto-tuning feature has made it possible to fine tune configuration based on series value range.
This allows you to not have to spend as much effort fine tuning your configuration again and again, and also reduces alert noise.
Note
The auto-tuning feature is only applied on the 'Smart detection' method.
Prerequisite for triggering auto-tuning
After the metrics are onboarded to Metrics Advisor, the system will try to perform statistics on the metrics to categorize anomaly pattern types and series value distribution. By providing this functionality, you can further fine tune the configuration based on their specific preferences. At the beginning, it will show a status of Initializing.

Choose to enable auto-tuning on anomaly pattern and series value
The feature enables you to tune detection configuration from two perspectives anomaly pattern and series value. Based on your specific use case, you can choose which one to enabled or enable both.
For the anomaly pattern option, the system will list out different anomaly patterns that were observed with the metric. You can choose which ones you're interested in and select them, the unselected patterns will have their sensitivity reduced by default.
For the series value option, your selection will depend on your specific use case. You'll have to decide if you want to use a higher sensitivity for series with higher values, and decrease sensitivity on low value ones, or vice versa. Then check the checkbox.

Tune the configuration for selected anomaly patterns
If specific anomaly patterns are chosen, the next step is to fine tune the configuration for each. There's a global sensitivity that is applied for all series. For each anomaly pattern, you can tune the adjustment, which is based on the global sensitivity.
You must tune each anomaly pattern that has been chosen individually.

Tune the configuration for each series value group
After the system generates statistics on all time series within the metric, several series value groups are created automatically. As described above, you can fine tune the adjustment for each series value group according to your specific business needs.
There will be a default adjustment configured to get the best detection results, but it can be further tuned.

Set up alert rules
Even once the detection configuration on capturing valid anomalies is tuned, it's still important to input alert rules to make sure the final alert rules can meet eventual business needs. There are a number of rules that can be set, like filter rules or snooze continuous alert rules.

After configuring all the settings described in the section above, the system will orchestrate them together and automatically detect anomalies based on your inputted preferences. The goal is to get the best configuration that works for each metric, which can be achieved much easier through use of the new auto-tuning capability.
Tune the configuration for all series in current metric
This configuration will be applied to all the series in this metric, except for ones with a separate configuration. A metric level configuration is applied by default when data is onboarded, and is shown on the left panel. Users can directly edit metric level config on metric page.
There are additional parameters like Direction, and Valid anomaly that can be used to further tune the configuration. You can combine different detection methods as well.

Tune the configuration for a specific series or group
Select Advanced configuration below the metric level configuration options to see the group level configuration.You can add a configuration for an individual series, or group of series by clicking the + icon in this window. The parameters are similar to the metric-level configuration parameters, but you may need to specify at least one dimension value for a group-level configuration to identify a group of series. And specify all dimension values for series-level configuration to identify a specific series.
This configuration will be applied to the group of series or specific series instead of the metric level configuration. After setting the conditions for this group, save it.

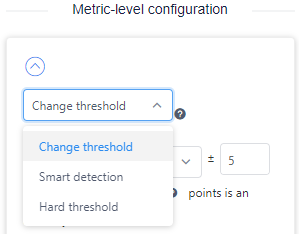
Anomaly detection methods
Metrics Advisor offers multiple anomaly detection methods: Hard threshold, Smart detection, Change threshold. You can use one or combine them using logical operators by clicking the '+' button.
Hard threshold
Hard threshold is a basic method for anomaly detection. You can set an upper and/or lower bound to determine the expected value range. Any points fall out of the boundary will be identified as an anomaly.
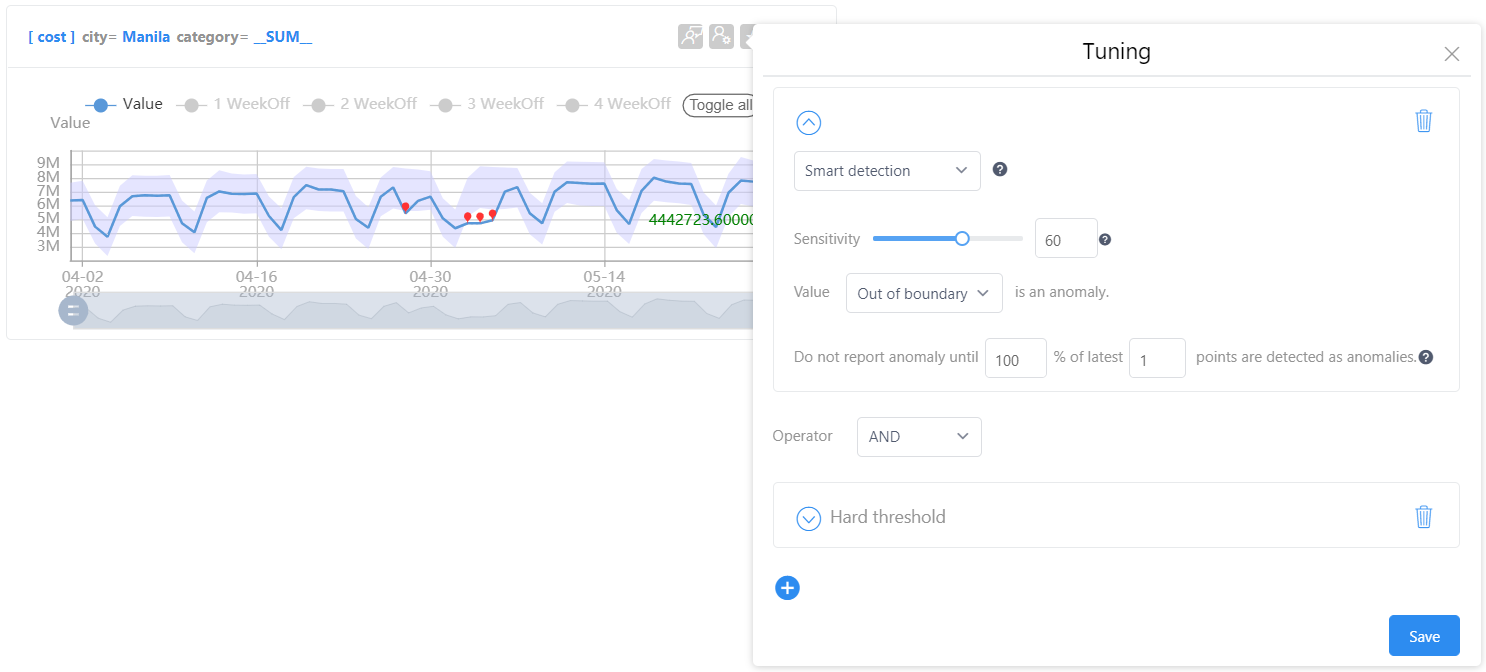
Smart detection
Smart detection is powered by machine learning that learns patterns from historical data, and uses them for future detection. When using this method, the Sensitivity is the most important parameter for tuning the detection results. You can drag it to a smaller or larger value to affect the visualization on the right side of the page. Choose one that fits your data and save it.
In smart detection mode, the sensitivity and boundary version parameters are used to fine-tune the anomaly detection result.
Sensitivity can affect the width of the expected value range of each point. When increased, the expected value range will be tighter, and more anomalies will be reported:

When the sensitivity is turned down, the expected value range will be wider, and fewer anomalies will be reported:
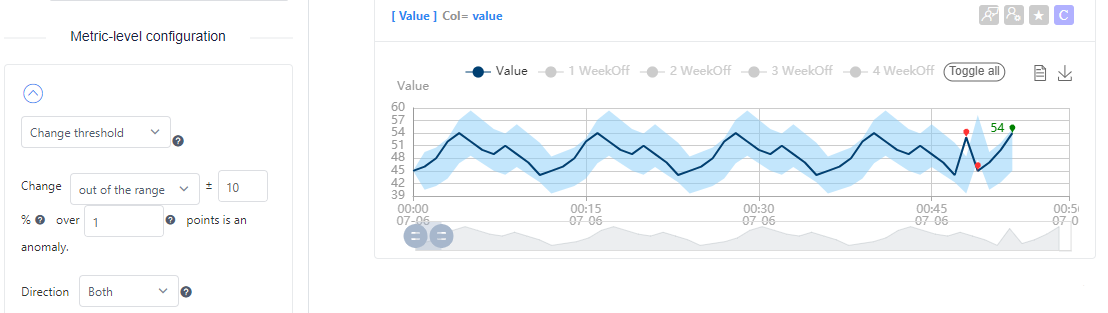
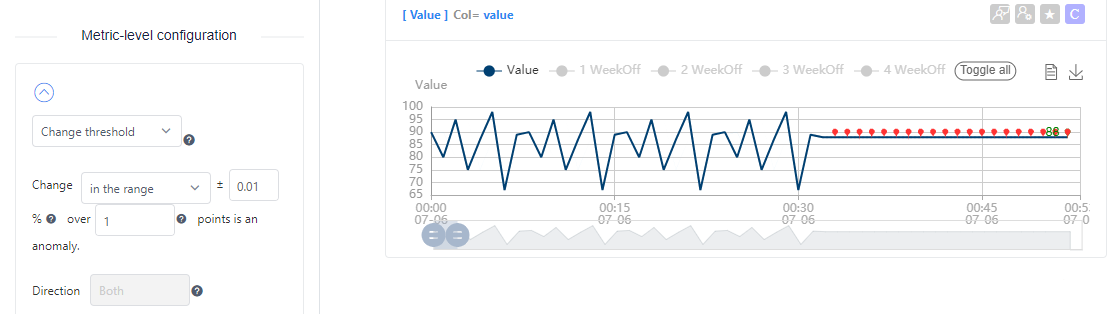
Change threshold
Change threshold is normally used when metric data generally stays around a certain range. The threshold is set according to Change percentage. The Change threshold mode is able to detect anomalies in the scenarios:
- Your data is normally stable and smooth. You want to be notified when there are fluctuations.
- Your data is normally unstable and fluctuates a lot. You want to be notified when it becomes too stable or flat.
Use the following steps to use this mode:
Select Change threshold as your anomaly detection method when you set the anomaly detection configurations for your metrics or time series.
Select the out of the range or in the range parameter based on your scenario.
If you want to detect fluctuations, select out of the range. For example, with the settings below, any data point that changes over 10% compared to the previous one will be detected as an outlier.
If you want to detect flat lines in your data, select in the range. For example, with the settings below, any data point that changes within 0.01% compared to the previous one will be detected as an outlier. Because the threshold is so small (0.01%), it detects flat lines in the data as outliers.
Set the percentage of change that will count as an anomaly, and which previously captured data points will be used for comparison. This comparison is always between the current data point, and a single data point N points before it.
Direction is only valid if you're using the out of the range mode:
- Up configures detection to only detect anomalies when (current data point) - (comparison data point) > + threshold percentage.
- Down configures detection to only detect anomalies when (current data point) - (comparing data point) < - threshold percentage.
Preset events
Sometimes, expected events and occurrences (such as holidays) can generate anomalous data. Using preset events, you can add flags to the anomaly detection output, during specified times. This feature should be configured after your data feed is onboarded. Each metric can only have one preset event configuration.
Note
Preset event configuration will take holidays into consideration during anomaly detection, and may change your results. It will be applied to the data points ingested after you save the configuration.
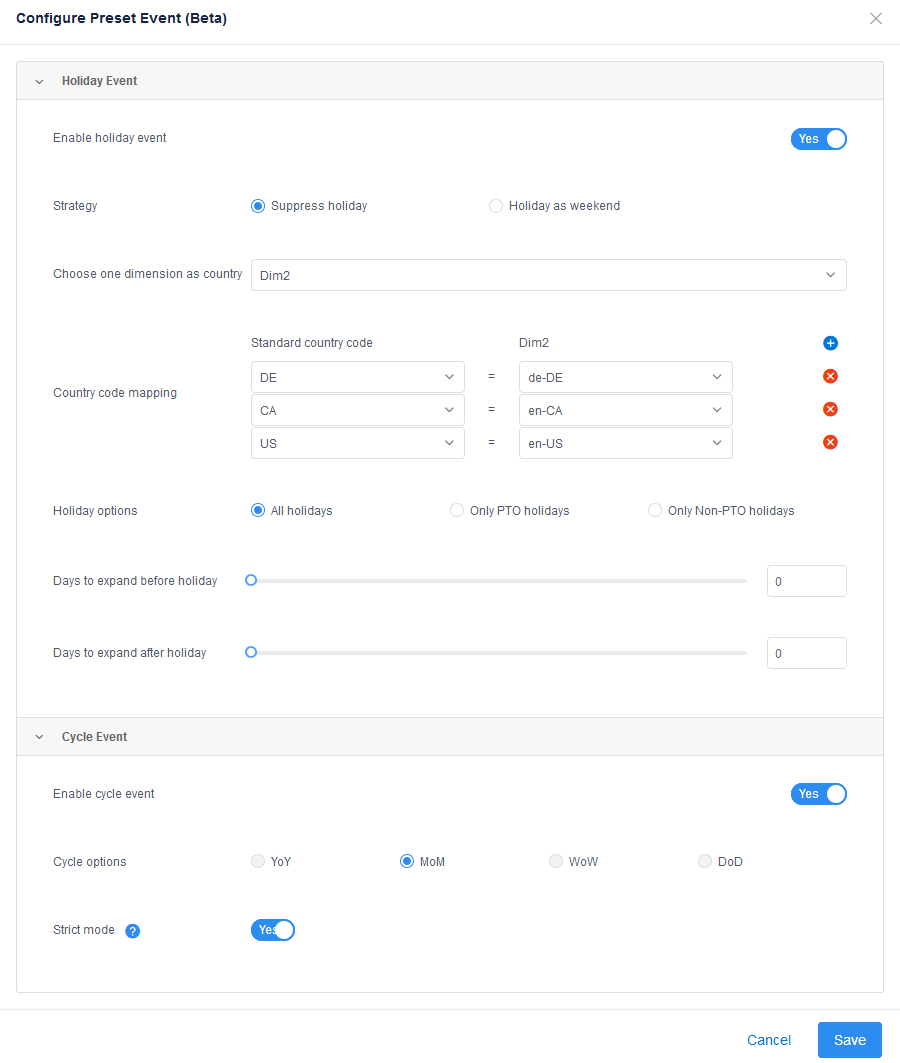
Select the Configure Preset Event button next to the metrics drop-down list on each metric details page.

In the window that appears, configure the options according to your usage. Make sure Enable holiday event is selected to use the configuration.
The Holiday event section helps you suppress unnecessary anomalies detected during holidays. There are two options for the Strategy option that you can apply:
- Suppress holiday: Suppresses all anomalies and alerts in anomaly detection results during holiday period.
- Holiday as weekend: Calculates the average expected values of several corresponding weekends before the holiday, and bases the anomaly status off of these values.
There are several other values you can configure:
| Option | Description |
|---|---|
| Choose one dimension as country | Choose a dimension that contains country information. For example, a country code. |
| Country code mapping | The mapping between a standard country code, and chosen dimension's country data. |
| Holiday options | Whether to take into account all holidays, only PTO (Paid Time Off) holidays, or only Non-PTO holidays. |
| Days to expand | The impacted days before and after a holiday. |
The Cycle event section can be used in some scenarios to help reduce unnecessary alerts by using cyclic patterns in the data. For example:
- Metrics that have multiple patterns or cycles, such as both a weekly and monthly pattern.
- Metrics that don't have a clear pattern, but the data is comparable Year over Year (YoY), Month over Month (MoM), Week Over Week (WoW), or Day Over Day (DoD).
Not all options are selectable for every granularity. The available options per granularity are below (✔ for available, X for unavailable):
| Granularity | YoY | MoM | WoW | DoD |
|---|---|---|---|---|
| Yearly | X | X | X | X |
| Monthly | X | X | X | X |
| Weekly | ✔ | X | X | X |
| Daily | ✔ | ✔ | ✔ | X |
| Hourly | ✔ | ✔ | ✔ | ✔ |
| Minutely | X | X | X | X |
| Secondly | X | X | X | X |
| Custom* | ✔ | ✔ | ✔ | ✔ |
When using a custom granularity in seconds, only available if the metric is longer than one hour and less than one day.
Cycle event is used to reduce anomalies if they follow a cyclic pattern, but it will report an anomaly if multiple data points don't follow the pattern. Strict mode is used to enable anomaly reporting if even one data point doesn't follow the pattern.
View recent incidents
Metrics Advisor detects anomalies on all your time series data as they're ingested. However, not all anomalies need to be escalated, because they might not have a significant impact. Aggregation will be performed on anomalies to group related ones into incidents. You can view these incidents from the Incident tab in metrics details page.
Select an incident to go to the Incidents analysis page where you can see more details about it. Select Manage incidents in new Incident hub, to find the Incident hub page where you can find all incidents under the specific metric.
Subscribe anomalies for notification
If you'd like to get notified whenever an anomaly is detected, you can subscribe to alerts for the metric, using a hook. For more information, see configure alerts and get notifications using a hook for more information.