Get started with Azure Automation State Configuration
Article
Note
Azure Automation State Configuration will be retired on September 30, 2027, please transition to
Azure Machine Configuration by that date. For more information, see the blog post
announcement. The Azure Machine Configuration service combines features of DSC Extension, Azure
Automation State Configuration, and the most commonly requested features from customer feedback.
Azure Machine Configuration also includes hybrid machine support through
Arc-enabled servers.
Important
The Add, Compose configuration, and Gallery navigation links will be removed from the
portal on March 31, 2025.
Caution
Azure Automation DSC for Linux has retired on 30 September 2023. For more information, see the announcement.
This article provides a step-by-step guide for doing the most common tasks with Azure Automation
State Configuration, such as:
If you want a sample environment that is already set up without following the steps described in
this article, you can use the Azure Automation Managed Node template. This template sets up a
complete State Configuration (DSC) environment, including an Azure virtual machine managed by State
Configuration (DSC).
Prerequisites
To complete the examples in this article, the following are required:
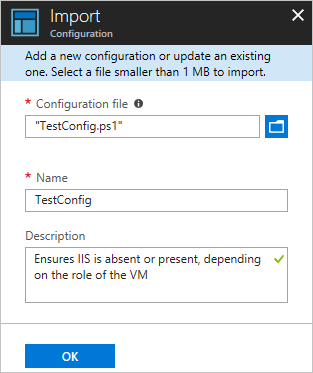
You create a simple DSC configuration that ensures either the presence or absence of the
Web-Server Windows Feature (IIS), depending on how you assign nodes.
Configuration names in Azure Automation must be limited to no more than 100 characters.
This configuration calls one resource in each node block, the WindowsFeature resource. This
resource ensures either the presence or absence of the Web-Server feature.
Import a configuration into Azure Automation
Next, you import the configuration into the Automation account.
On the left, select All resources and then the name of your Automation account.
On the Automation account page, select State configuration (DSC) under Configuration
Management.
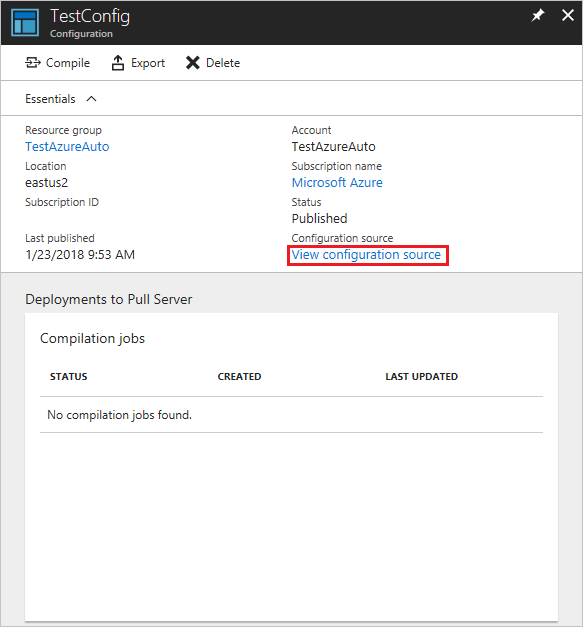
On the State configuration (DSC) page, select the Configurations tab, then select the name of
the configuration you imported in the previous procedure, TestConfig.
On the TestConfig Configuration pane, select View configuration source.
A TestConfig Configuration source pane opens, displaying the PowerShell code for the
configuration.
Compile a configuration in Azure Automation
Before you can apply a desired state to a node, a DSC configuration defining that state must be
compiled into one or more node configurations (MOF document), and placed on the Automation DSC Pull
Server. For a more detailed description of compiling configurations in State Configuration (DSC),
see Compile configurations in Azure Automation State Configuration. For more information about
compiling configurations, see DSC Configurations.
On the left, select All resources and then the name of your Automation account.
On the Automation account page, select State configuration (DSC) under Configuration
Management.
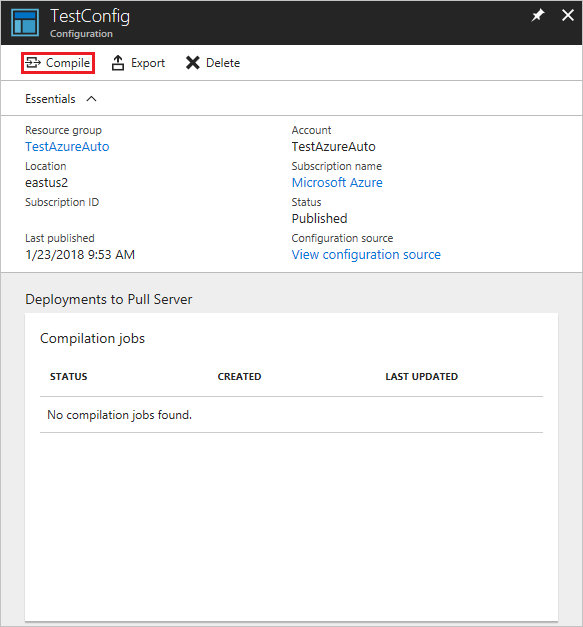
On the State configuration (DSC) page, select the Configurations tab, then select the name of
the previously imported configuration, TestConfig.
To start the compilation job, select Compile on the TestConfig Configuration pane, and then
select Yes.
Note
When you compile a configuration in Azure Automation, it automatically deploys any created node
configuration MOF files to the pull server.
View a compilation job
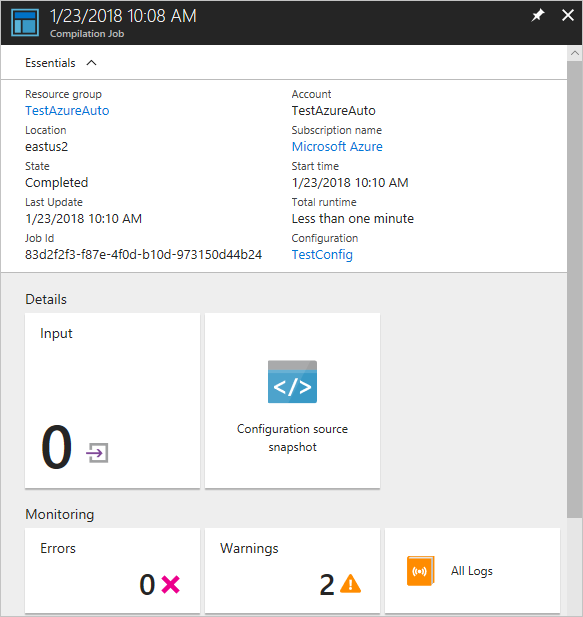
After you start a compilation, you can view it in the Compilation Jobs tile on the
Configuration page. The Compilation Jobs tile shows currently running, completed, and failed
jobs. When you open a compilation job pane, it shows information about that job including any errors
or warnings encountered, input parameters used in the configuration, and compilation logs.
On the left, select All resources and then the name of your Automation account.
On the Automation account page, select State configuration (DSC) under Configuration
Management.
On the State configuration (DSC) page, select the Configurations tab, then select the name of
the previously imported configuration, TestConfig.
Under Compilation jobs, select the compilation job to view. A Compilation Job pane opens,
labeled with the date when the compilation job was started.
To see further details about the job, select any tile in the Compilation Job pane.
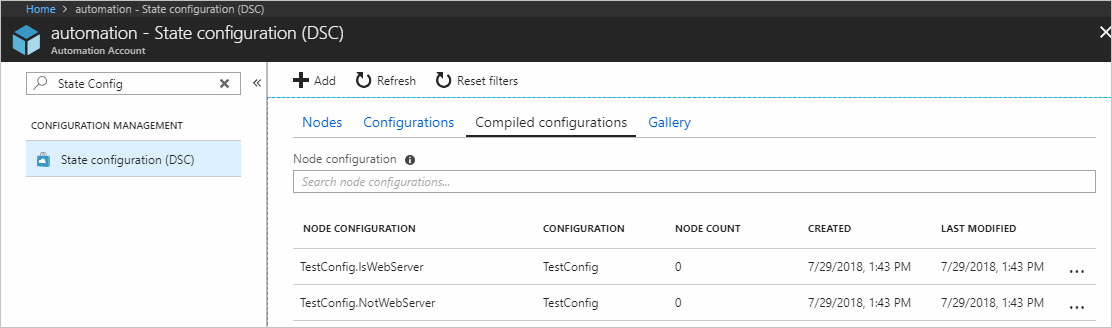
View node configurations
Successful completion of a compilation job creates one or more new node configurations. A node
configuration is a MOF document that you deploy to the pull server. You can view the node
configurations in your Automation account on the State configuration (DSC) page. A node
configuration has a name with the form ConfigurationName.NodeName.
On the left, select All resources and then the name of your Automation account.
On the Automation account page, select State configuration (DSC) under Configuration
Management.
On the State configuration (DSC) page, select the Compiled configurations tab.
Enable an Azure Resource Manager VM for management with State Configuration
You can use State Configuration to manage Azure VMs (both classic and Resource Manager), on-premises
VMs, Linux machines, AWS VMs, and on-premises physical machines. In this article, you learn how to
enable only Azure Resource Manager VMs. For information about enabling other types of machines, see
Enable machines for management by Azure Automation State Configuration.
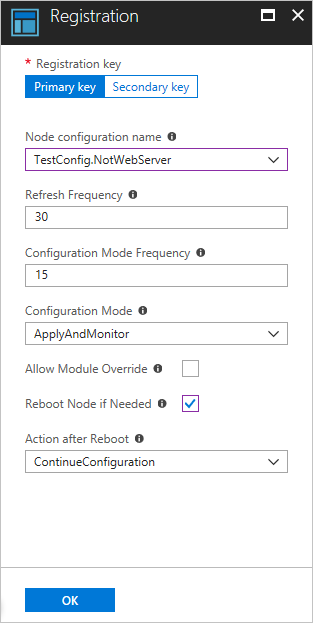
On the Registration page, select the name of the node configuration to apply to the VM in the
Node configuration name field. Providing a name at this point is optional. You can change the
assigned node configuration after enabling the node.
Check Reboot Node if Needed, then select OK.
The node configuration you specified is applied to the VM at intervals specified by the value
provided for Configuration Mode Frequency. The VM checks for updates to the node
configuration at intervals specified by the Refresh Frequency value. For more information
about how these values are used, see Configuring the Local Configuration Manager.
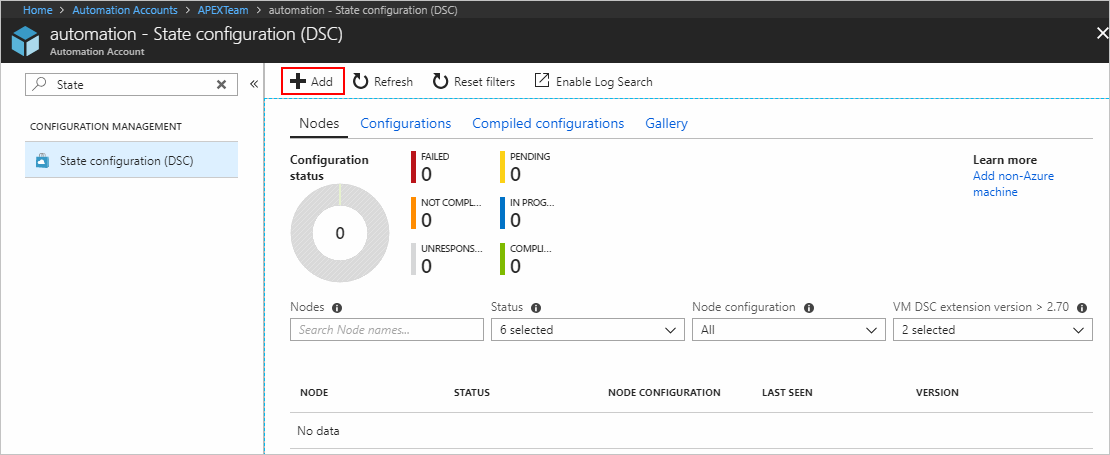
Azure starts the process of enabling the VM. When complete, the VM shows up in the Nodes tab of
the State configuration (DSC) page in the Automation account.
View the list of managed nodes
The Nodes tab of the State configuration (DSC) page contains a list of all machines enabled for
management in your Automation account.
On the left, select All resources and then the name of your Automation account.
On the Automation account page, select State configuration (DSC) under Configuration
Management.
On the State configuration (DSC) page, select the Nodes tab.
DSC nodes status values
The DSC node can take any of the following six values as follows:
Failed - This status is displayed when an error occurs while applying one or more
configurations on a node.
Not compliant - This status is displayed when drift occurs on a node and it requires a close
review.
Unresponsive - This status is displayed when a node hasn't been checked in for more than 24
hours.
Pending - This status is displayed when a node has a new configuration to apply and the pull
server is waiting for the node to check in.
In progress - This status is displayed when a node applies configuration, and the pull server
is awaiting status.
Compliant - This status is displayed when a node has a valid configuration, and no drift
occurs presently.
Note
RefreshFrequencyMins - It defines the frequency of node contacting the agent service and can
be provided as part of onboarding to DSC. It takes a maximum value of 10080 minutes.
Node will be marked as Unresponsive if the node does not contact the agent service for 1440
minutes (1 Day). We recommend that you use RefreshFrequencyMins value < 1440 minutes, else
the node would show in a false Unresponsive state.
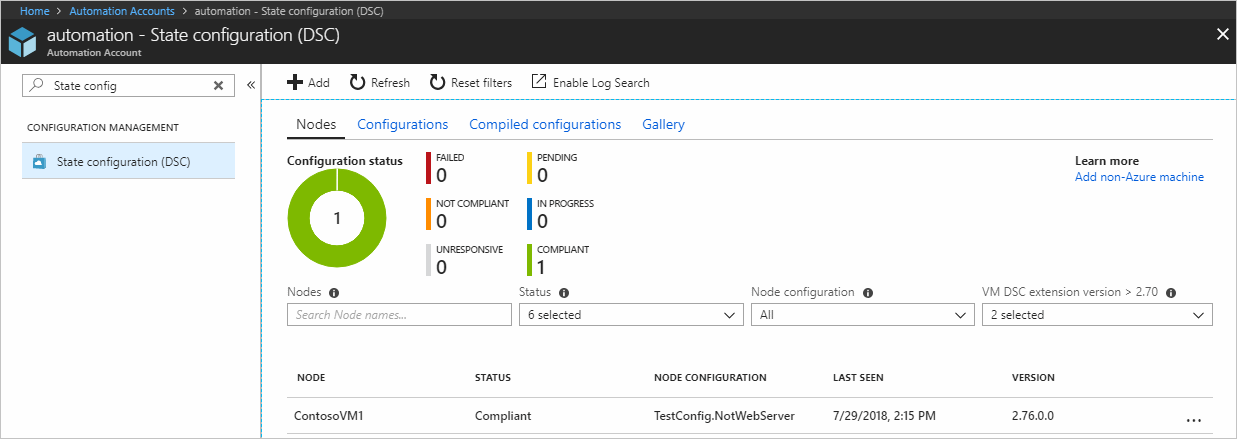
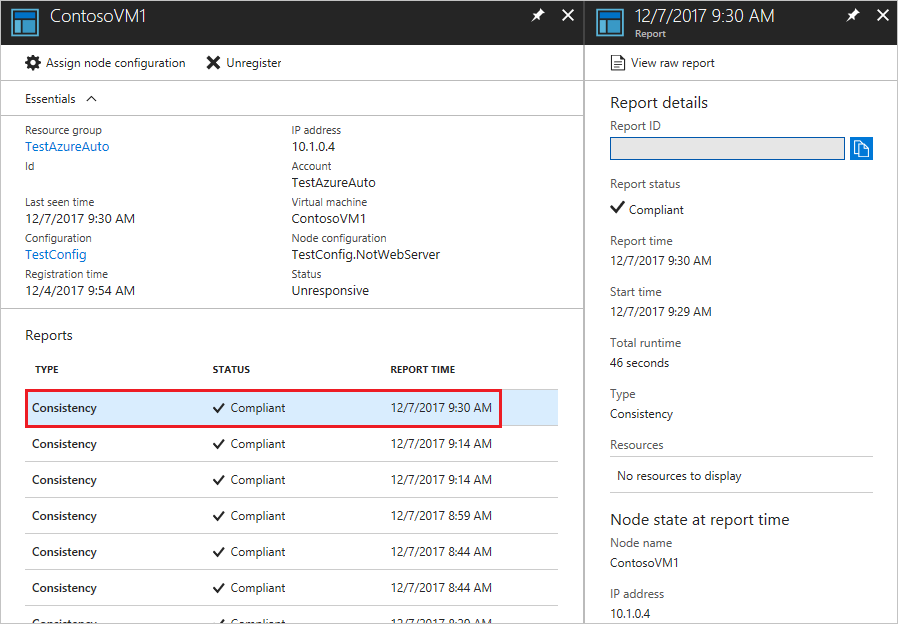
View reports for managed nodes
Each time State Configuration performs a consistency check on a managed node, the node sends a
status report back to the pull server. You can view these reports on the page for that node.
On the left, select All resources and then the name of your Automation account.
On the Automation account page, select State configuration (DSC) under Configuration
Management.
On the State configuration (DSC) page, select the Nodes tab. Here, you can see the overview of
Configuration state and the details for each node.
While on the Nodes tab, select the node record to open the reporting. Select the report you
want to view.
You can see the following status information for the corresponding consistency check:
The report status. Possible values are:
Compliant - the node is compliant with the check.
Failed - the configuration failed the check.
Not Compliant - the node is in ApplyandMonitor mode and the machine isn't in the desired
state.
The start time for the consistency check.
The total runtime for the consistency check.
The type of consistency check.
Any errors, including the error code and error message.
Any DSC resources used in the configuration, and the state of each resource (whether the node is
in the desired state for that resource). You can select on each resource to get more detailed
information for that resource.
The name, IP address, and configuration mode of the node.
You can also select View raw report to see the actual data that the node sends to the server. For
more information about using that data, see Using a DSC report server.
It can take some time before the first report is available, after a node is enabled or restarted. You might need to wait up to 30 minutes after you enable a node or restart a node.
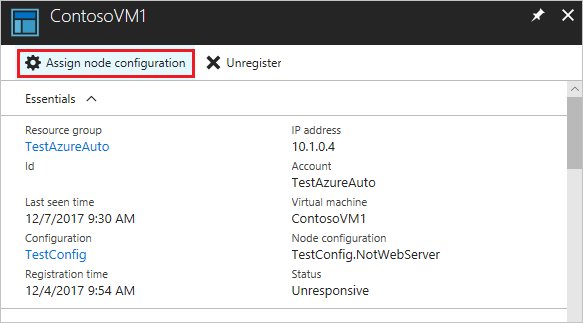
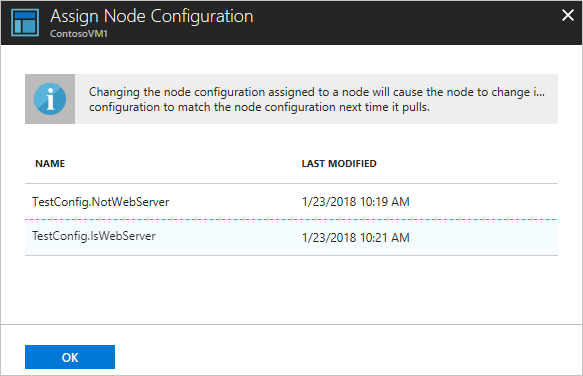
Reassign a node to a different node configuration
You can assign a node to use a different node configuration than the one you initially assigned.