Tutorial: Monitor a hybrid machine with VM insights
Azure Monitor can collect data directly from your hybrid machines into a Log Analytics workspace for detailed analysis and correlation. Typically, this would require installing the Log Analytics agent on the machine using a script, manually, or an automated method following your configuration management standards. Now, Azure Arc-enabled servers can install the Log Analytics and Dependency agent VM extension for Windows and Linux, enabling VM insights to collect data from your non-Azure VMs.
In this tutorial, you will learn how to:
- Enable and configure VM insights for your Linux or Windows non-azure VMs
- Collect and view data from these VMs
Prerequisites
If you don't have an Azure subscription, create a free account before you begin.
VM extension functionality is available only in the list of supported regions.
See Supported operating systems to ensure that the servers operating system you're enabling is supported by VM insights.
Review firewall requirements for the Log Analytics agent provided in the Log Analytics agent overview. The VM insights Map Dependency agent doesn't transmit any data itself, and it doesn't require any changes to firewalls or ports.
Enable VM insights
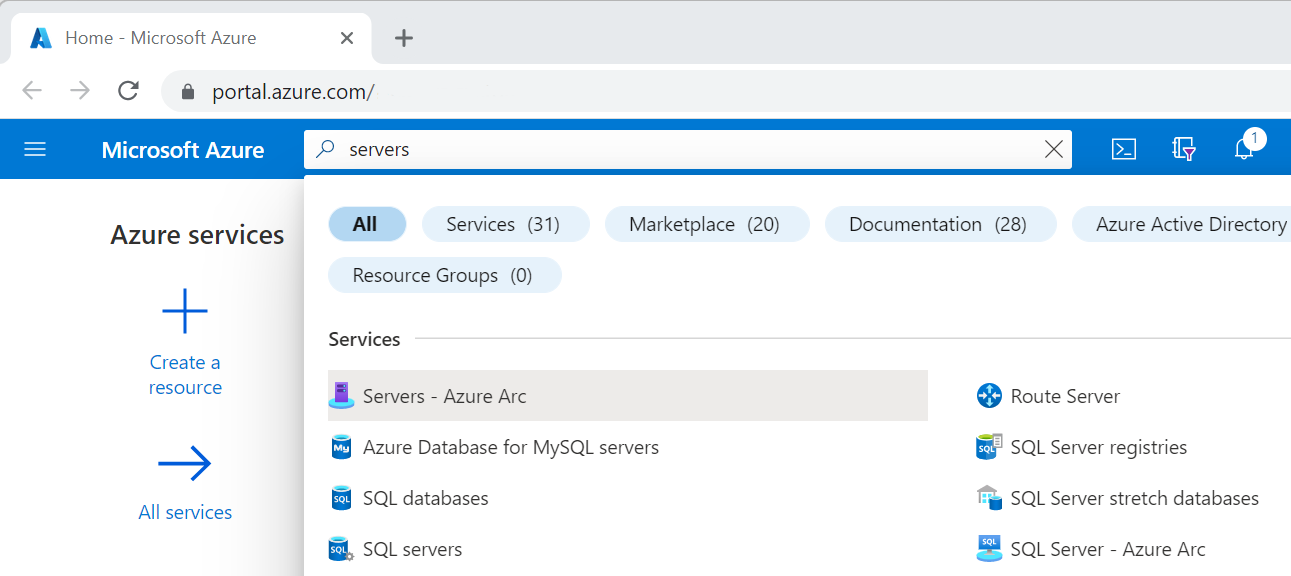
Launch the Azure Arc service in the Azure portal by clicking All services, then searching for and selecting Machines - Azure Arc.
On the Azure Arc - Machines page, select the connected machine you created in the quickstart article.
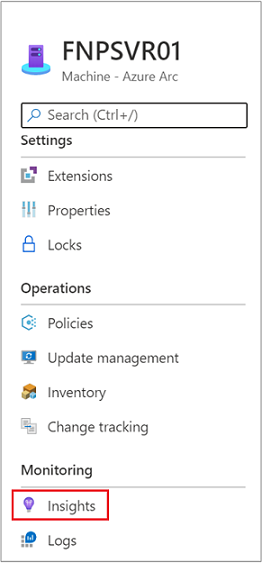
From the left-pane under the Monitoring section, select Insights and then Enable.
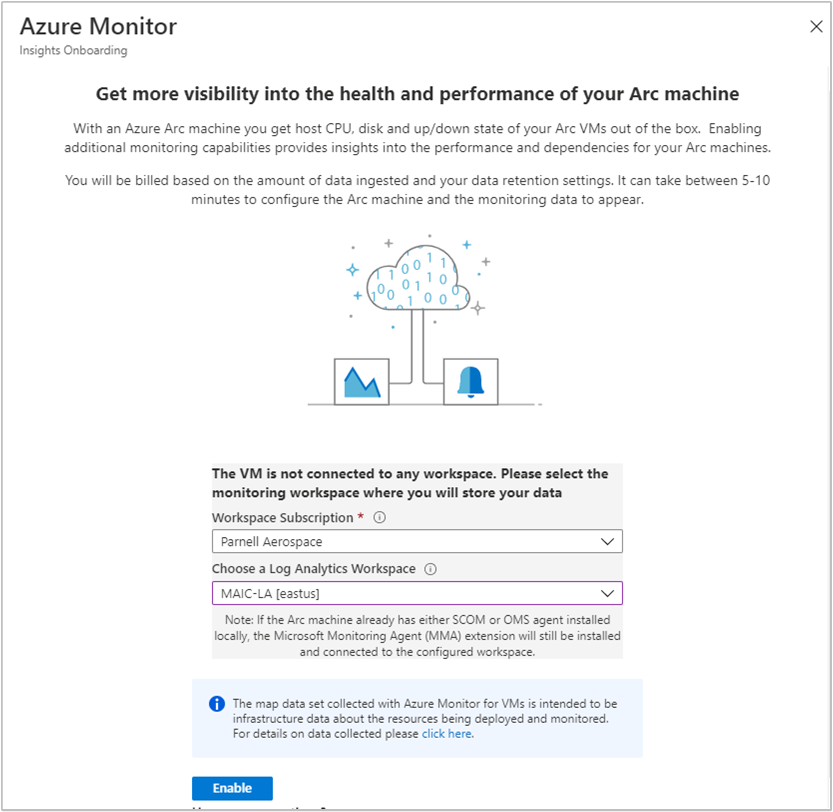
On the Azure Monitor Insights Onboarding page, you're prompted to create a workspace. For this tutorial, don't select an existing Log Analytics workspace if you already have one. Instead, select the default, which is a workspace with a unique name in the same region as your registered connected machine. This workspace is created and configured for you.
Status messages display while the configuration is performed and extensions are installed on your connected machine. This process takes a few minutes.
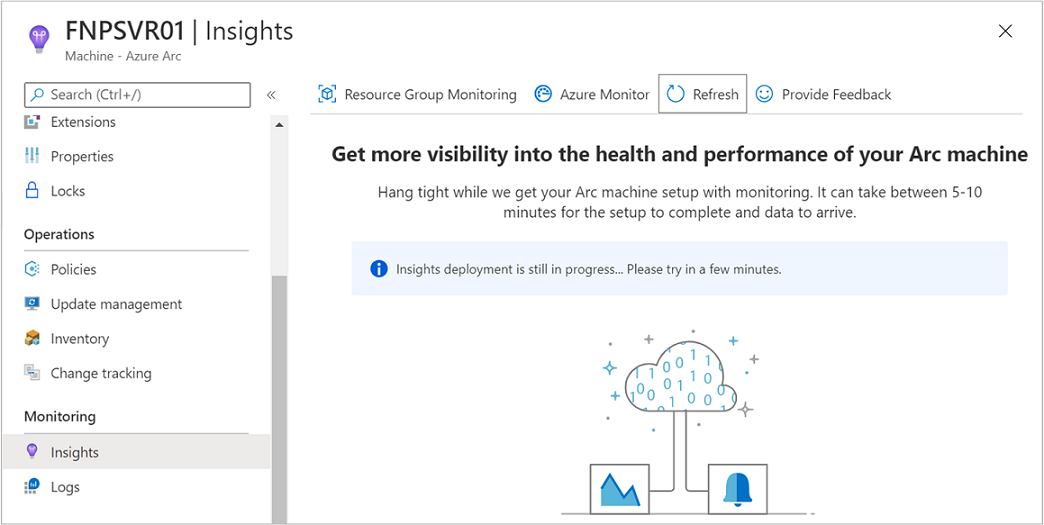
When the process is complete, a message displays that the machine has been onboarded and that insight has been successfully deployed.
View data collected
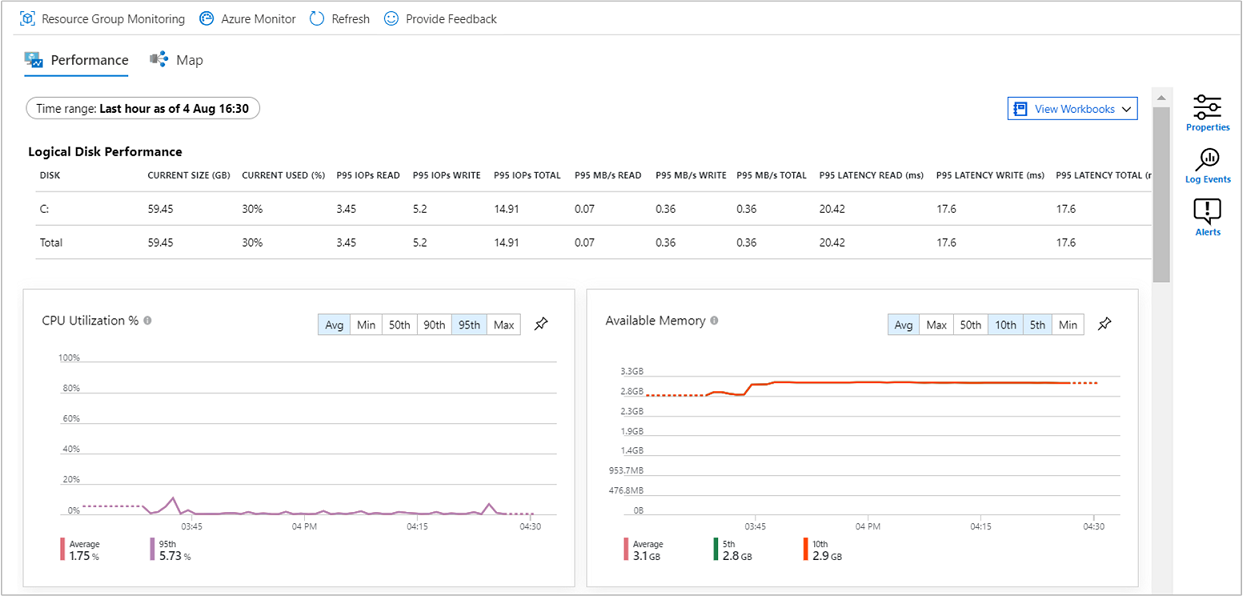
After deployment and configuration is complete, select Insights, and then select the Performance tab. The Performance tab shows a select group of performance counters collected from the guest operating system of your machine. Scroll down to view more counters, and move the mouse over a graph to view average and percentiles taken starting from the time when the Log Analytics VM extension was installed on the machine.
Select Map. The maps feature shows the processes running on the machine and their dependencies. Select Properties to open the property pane (if it isn't already open).
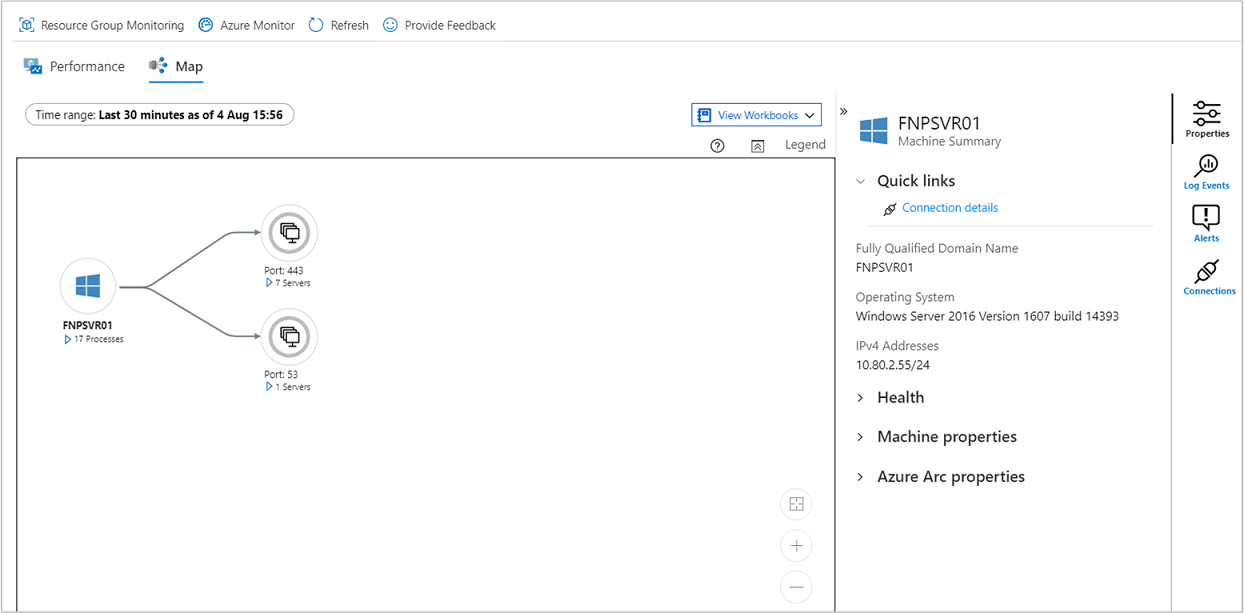
Expand the processes for your machine. Select one of the processes to view its details and to highlight its dependencies.
Select your machine again and then select Log Events. You see a list of tables that are stored in the Log Analytics workspace for the machine. This list will be different depending whether you're using a Windows or Linux machine.
Select the Event table. The Event table includes all events from the Windows event log. Log Analytics opens with a simple query to retrieve collected event log entries.
Next steps
To learn more about Azure Monitor, see the following article:
Feedback
Coming soon: Throughout 2024 we will be phasing out GitHub Issues as the feedback mechanism for content and replacing it with a new feedback system. For more information see: https://aka.ms/ContentUserFeedback.
Submit and view feedback for