How to monitor Azure Cache for Redis
Azure Cache for Redis uses Azure Monitor to provide several options for monitoring your cache instances. Use these tools to monitor the health of your Azure Cache for Redis instances and to help you manage your caching applications.
Use Azure Monitor to:
- view metrics
- pin metrics charts to the dashboard
- customize the date and time range of monitoring charts
- add and remove metrics from the charts
- set alerts when certain conditions are met
Metrics for Azure Cache for Redis instances are collected using the Redis INFO command. Metrics are collected approximately two times per minute and automatically stored for 30 days so they can be displayed in the metrics charts and evaluated by alert rules.
To configure a different retention policy, see Data storage. For more information about the different INFO values used for each cache metric, see Create your own metrics.
For detailed information about all the monitoring options available for Azure Cache for Redis, see Monitor Azure Cache for Redis.
View cache metrics
You can view Azure Monitor metrics for Azure Cache for Redis directly from an Azure Cache for Redis resource in the Azure portal.
Select your Azure Cache for Redis instance in the portal. The Overview page shows the predefined Memory Usage and Redis Server Load monitoring charts. These charts are useful summaries that allow you to take a quick look at the state of your cache.
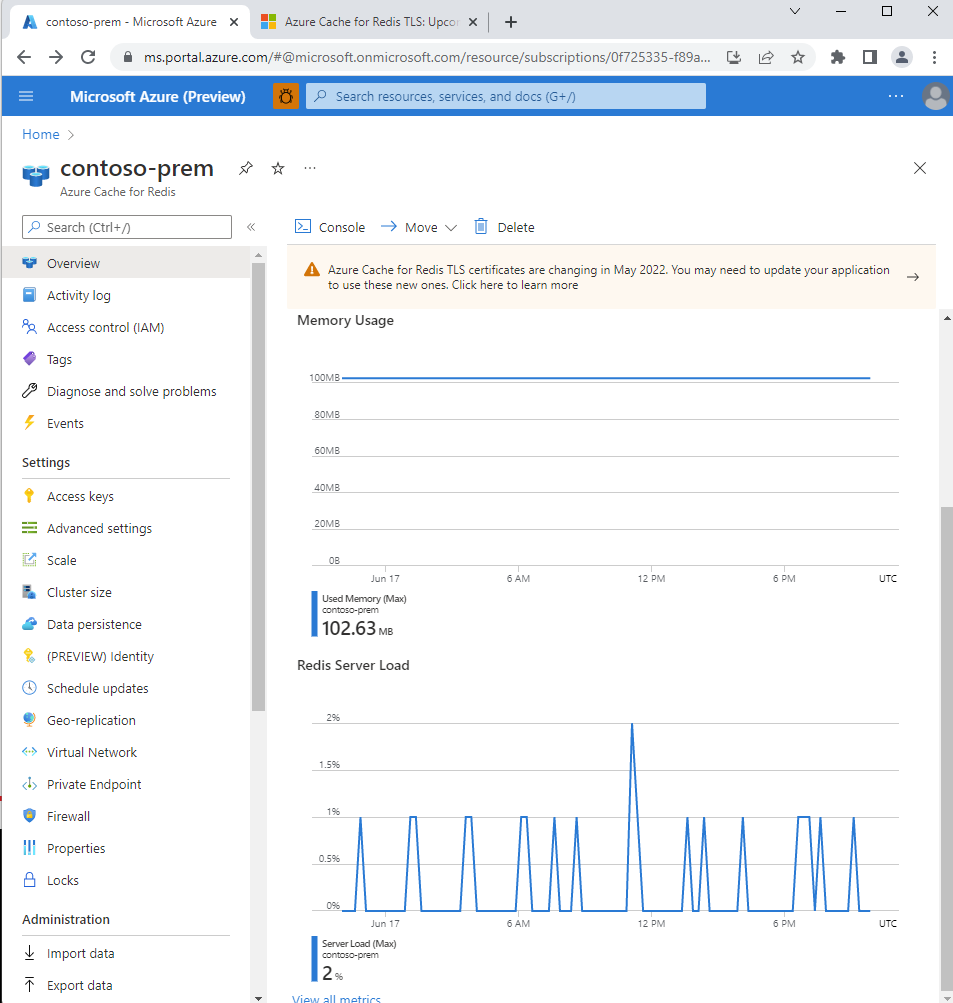
For more in-depth information, you can monitor the following useful Azure Cache for Redis metrics from the Monitoring section of the Resource menu.
| Azure Cache for Redis metric | More information |
|---|---|
| Network bandwidth usage | Cache performance - available bandwidth |
| Connected clients | Default Redis server configuration - max clients |
| Server load | Redis Server Load |
| Memory usage | Cache performance - size |
For a complete list and description of metrics you can monitor, see Azure Cache for Redis metrics.
The other options under Monitoring provide other ways to monitor your caches. For detailed information, see Monitor Azure Cache for Redis.
Create your own metrics
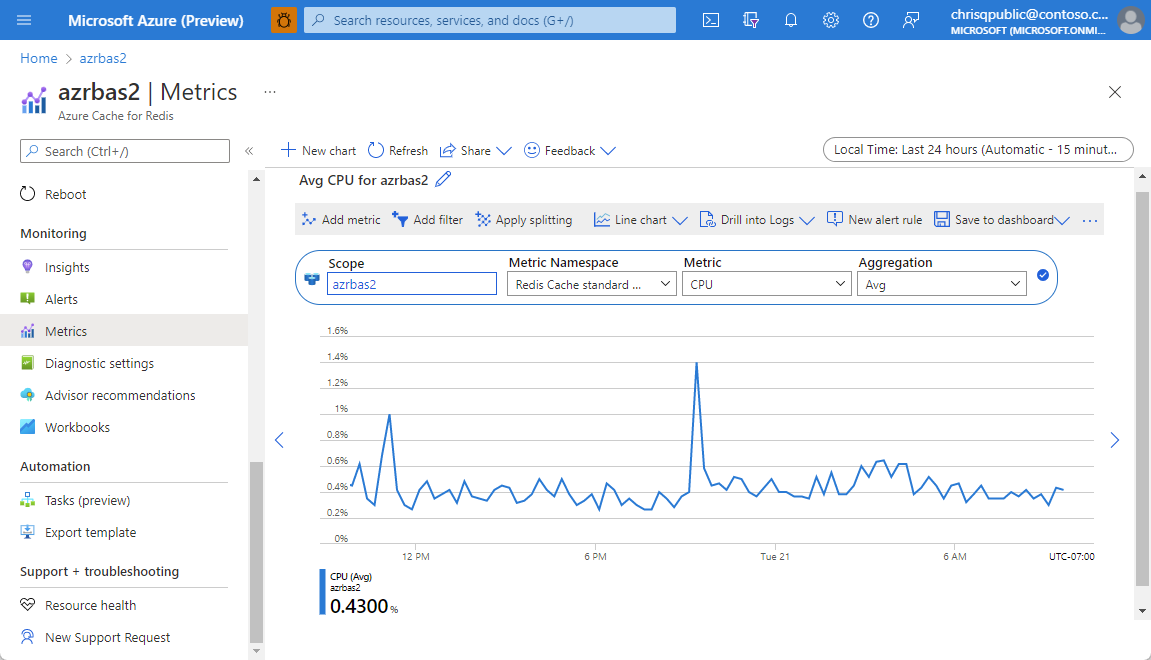
You can create your own custom chart to track the metrics you want to see. Cache metrics are reported using several reporting intervals, including Past hour, Today, Past week, and Custom. On the left, select the Metric in the Monitoring section. Each metrics chart displays the average, minimum, and maximum values for each metric in the chart, and some metrics display a total for the reporting interval.
Each metric includes two versions: One metric measures performance for the entire cache, and for caches that use clustering. A second version of the metric, which includes (Shard 0-9) in the name, measures performance for a single shard in a cache. For example if a cache has four shards, Cache Hits is the total number of hits for the entire cache, and Cache Hits (Shard 3) measures just the hits for that shard of the cache.
In the Resource menu on the left, select Metrics under Monitoring. Here, you design your own chart for your cache, defining the metric type and aggregation type.
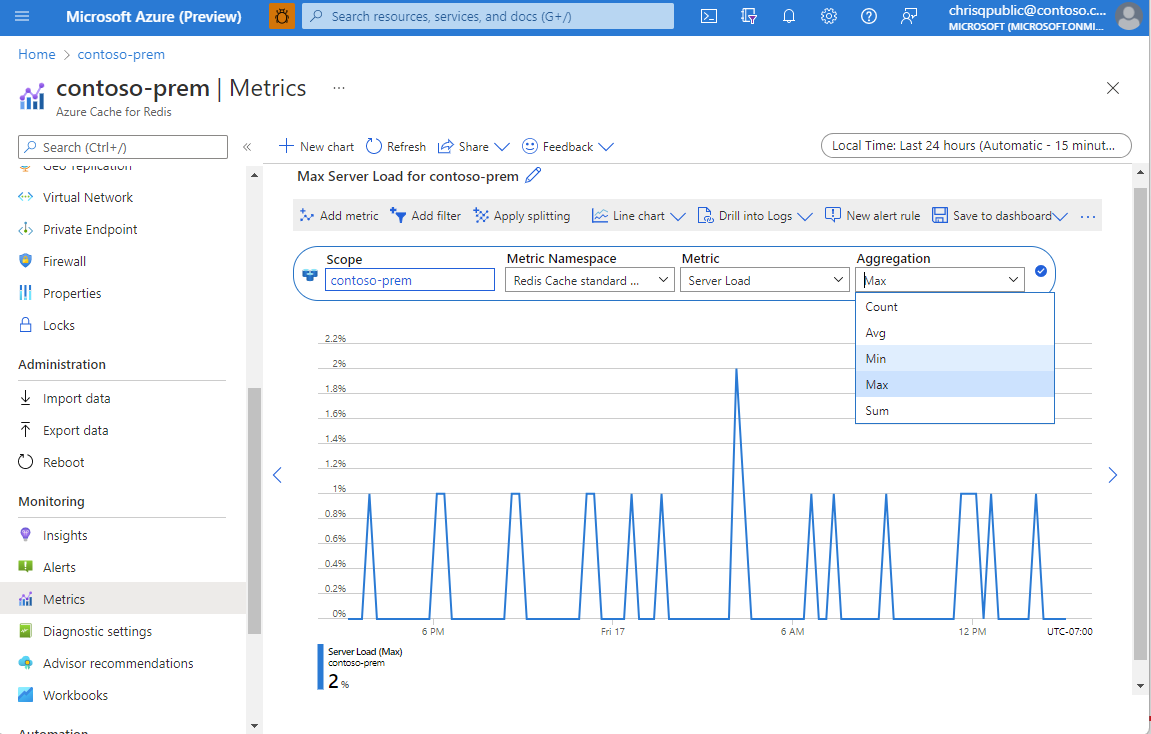
Aggregation types
Under normal conditions, Average and Max are similar because only one node emits these metrics (the primary node). In a scenario where the number of connected clients changes rapidly, Max, Average, and Min would show different values and is also expected behavior.
Generally, Average shows you a smooth chart of your desired metric and reacts well to changes in time granularity. Max and Min can hide large changes in the metric if the time granularity is large but can be used with a small time granularity to help pinpoint exact times when large changes occur in the metric.
The types Count and Sum can be misleading for certain metrics (connected clients included). Instead, we suggest you look at the Average metrics and not the Sum metrics.
Note
Even when the cache is idle with no connected active client applications, you might see some cache activity, such as connected clients, memory usage, and operations being performed. The activity is normal in the operation of cache.
For nonclustered caches, we recommend using the metrics without the suffix Instance Based. For example, to check server load for your cache instance, use the metric Server Load.
In contrast, for clustered caches, we recommend using the metrics with the suffix Instance Based. Then, add a split or filter on ShardId. For example, to check the server load of shard 1, use the metric Server Load (Instance Based), then apply filter ShardId = 1.
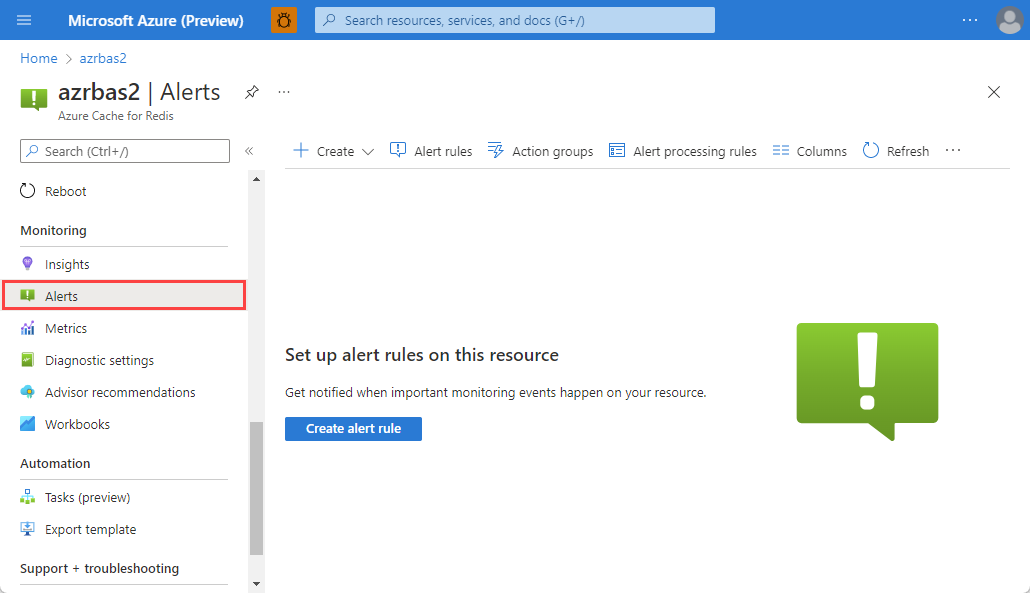
Create alerts
You can configure to receive alerts based on metrics and activity logs. Azure Monitor allows you to configure an alert to do the following when it triggers:
- Send an email notification
- Call a webhook
- Invoke an Azure Logic App
To configure alerts for your cache, select Alerts under Monitoring on the Resource menu.
For more information about configuring and using alerts, see Overview of Alerts and Azure Cache for Redis alerts.
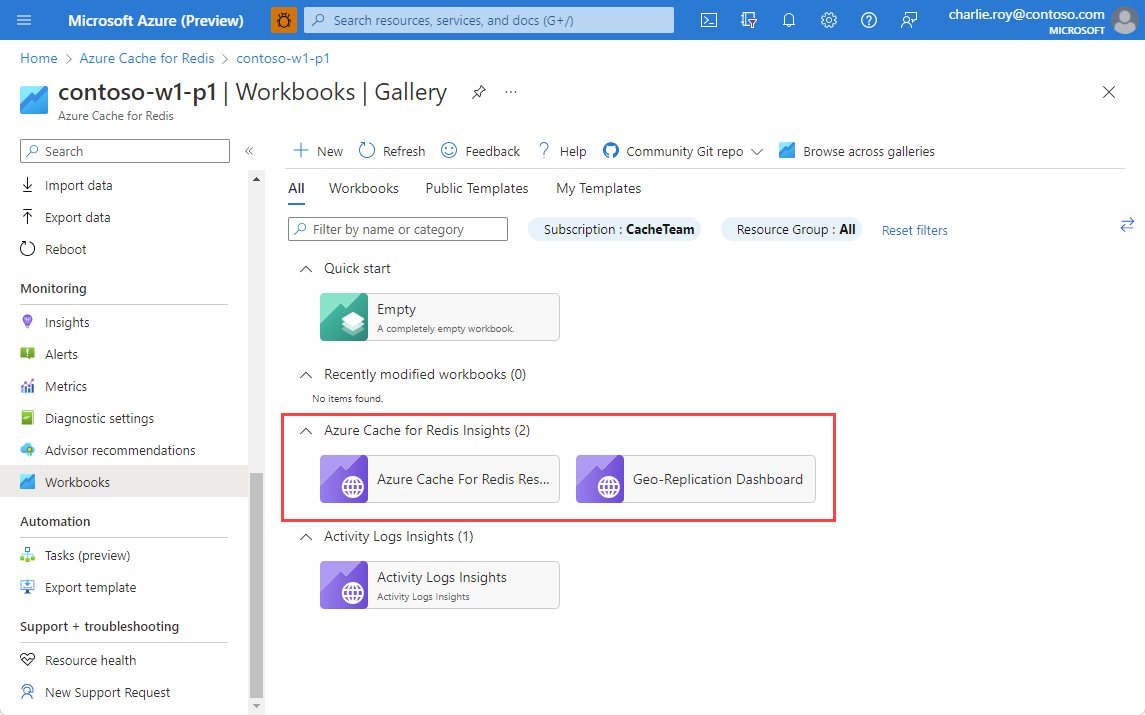
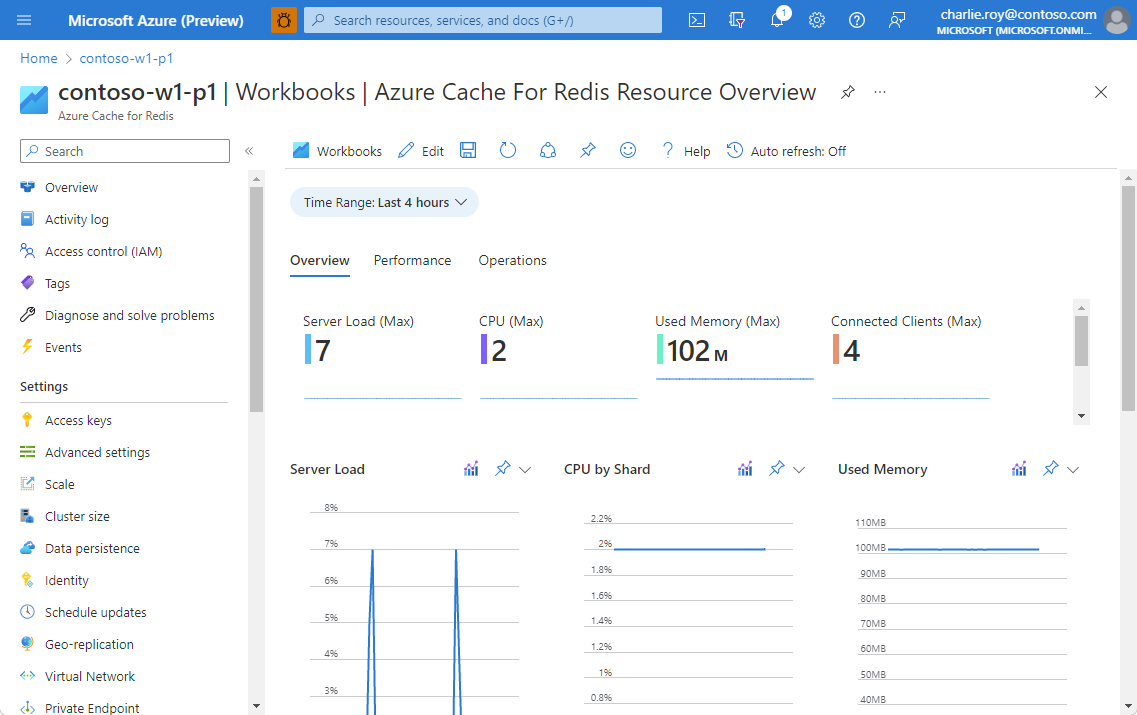
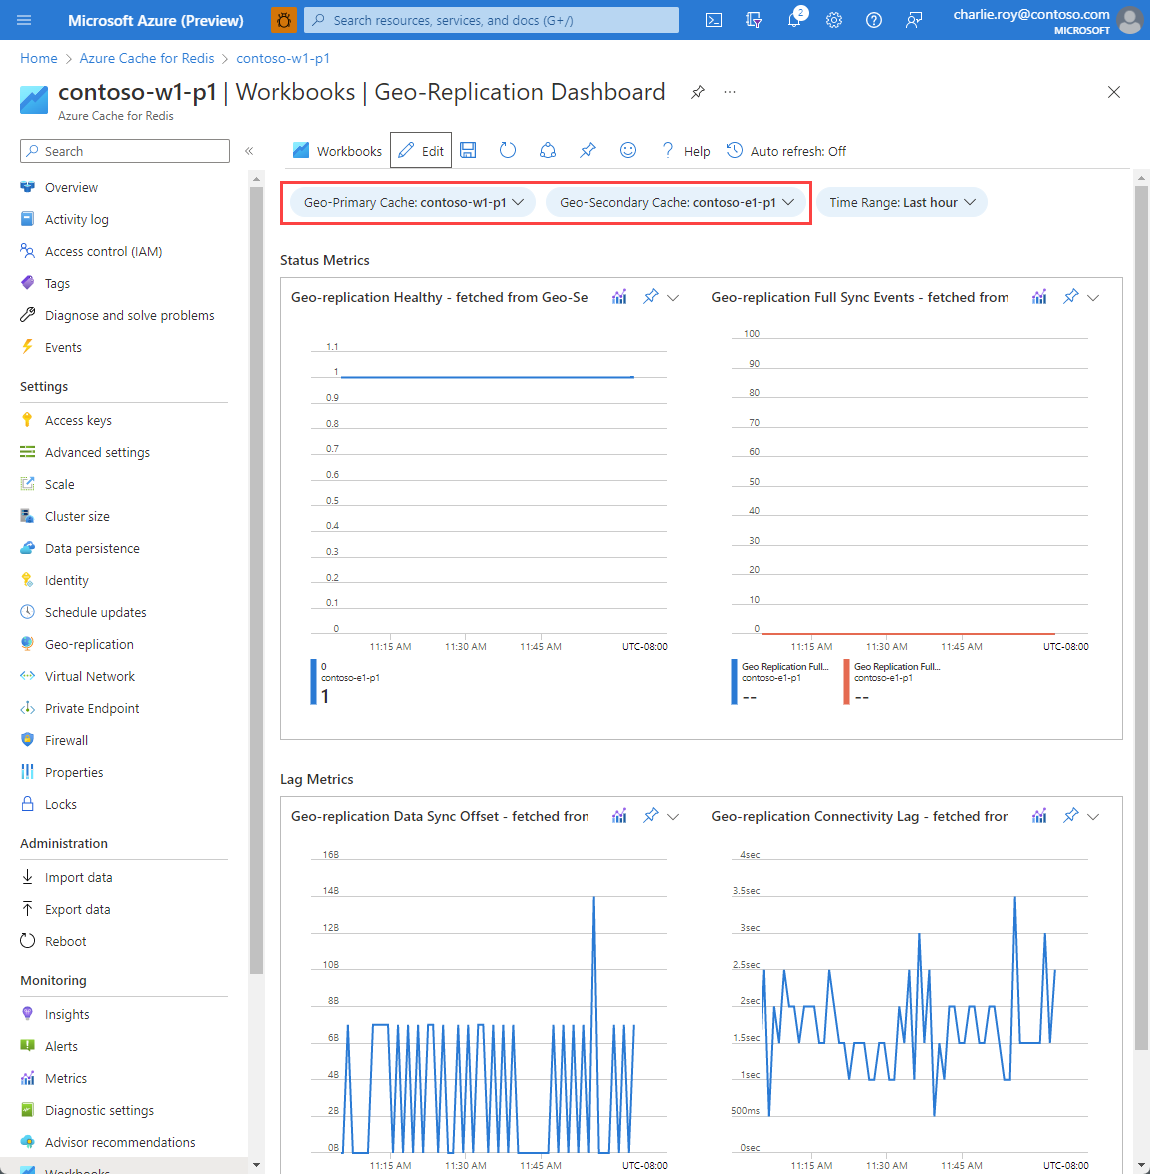
Organize with workbooks
Once you define a metric, you can send it to a workbook. Workbooks provide a way to organize your metrics into groups that provide the information in coherent way. Azure Cache for Redis provides two workbooks by default in the Azure Cache for Redis Insights section:
For information on creating a metric, see Create your own metrics.
The two workbooks provided are:
Azure Cache For Redis Resource Overview combines many of the most commonly used metrics so that the health and performance of the cache instance can be viewed at a glance.
Geo-Replication Dashboard pulls geo-replication health and status metrics from both the geo-primary and geo-secondary cache instances to give a complete picture of geo-replication health. Using this dashboard is recommended, as some geo-replication metrics are only emitted from either the geo-primary or geo-secondary.
Related content
Feedback
Coming soon: Throughout 2024 we will be phasing out GitHub Issues as the feedback mechanism for content and replacing it with a new feedback system. For more information see: https://aka.ms/ContentUserFeedback.
Submit and view feedback for